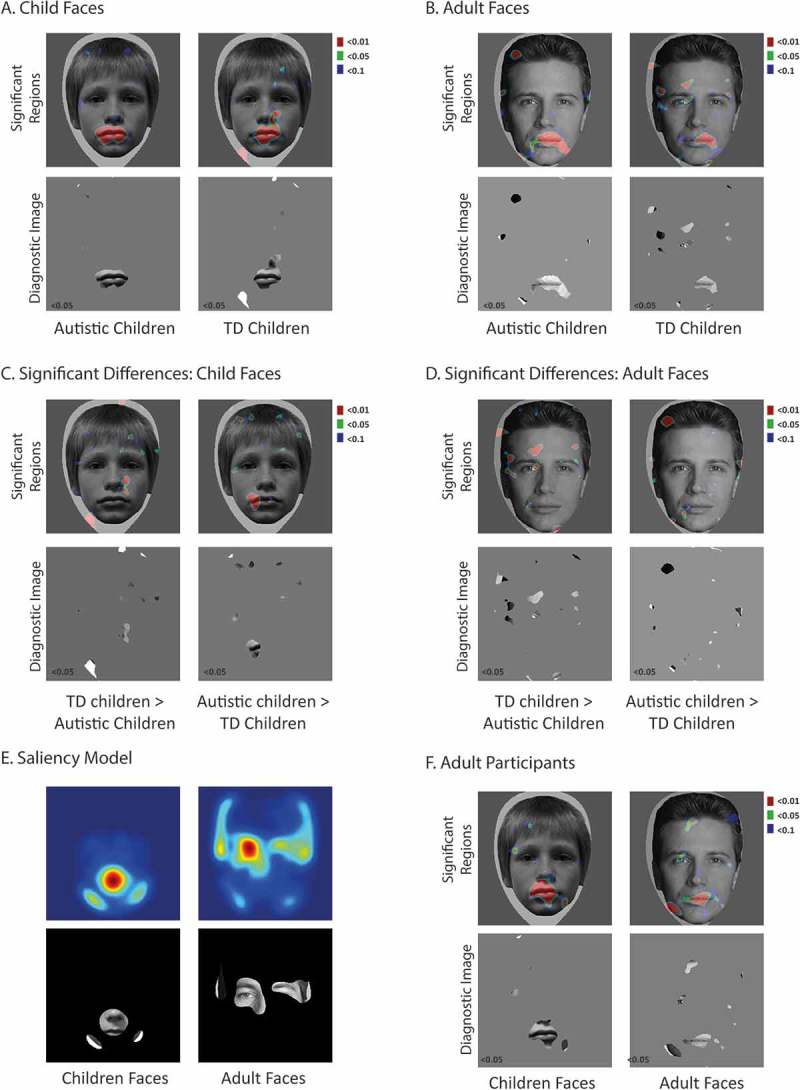
Figure 2.

A. Child Faces. Top row: The visual information significantly associated with correct categorization performance for each stimulus face age in each participant group shown on a sample face image (red regions are significant p<0.01, green regions at p<0.05, blue regions at p<0.1). For the autistic group, the mouth significantly drives correct performance. Second row: Diagnostic images depicting only that information significantly associated with correct performance (p<0.05). Figure 2B. As Figure 2A for adult face stimuli. Figure 2C. Child faces. Top row: The visual information that is used significantly more by typical children than autistic children (left column) and more by autistic children than typical children (right column) on a sample face stimulus (red regions at p<0.01, green regions at p<0.05 and blue at p<0.1). Bottom row: Diagnostic images depicting only that information whose use differs significantly between the typical children and autistic children. Figure 2D. As Figure 2C for the adult face images. Figure 2E. Computationally determined salient visual information available to differentiate the two face identities in each task (red colour indicates greatest salience, blue colour indicates minimal values). A thresholded version applied to a sample stimulus image highlights the corresponding visual information for comparison. Figure 2F. As Figure 2A for the adult participants
