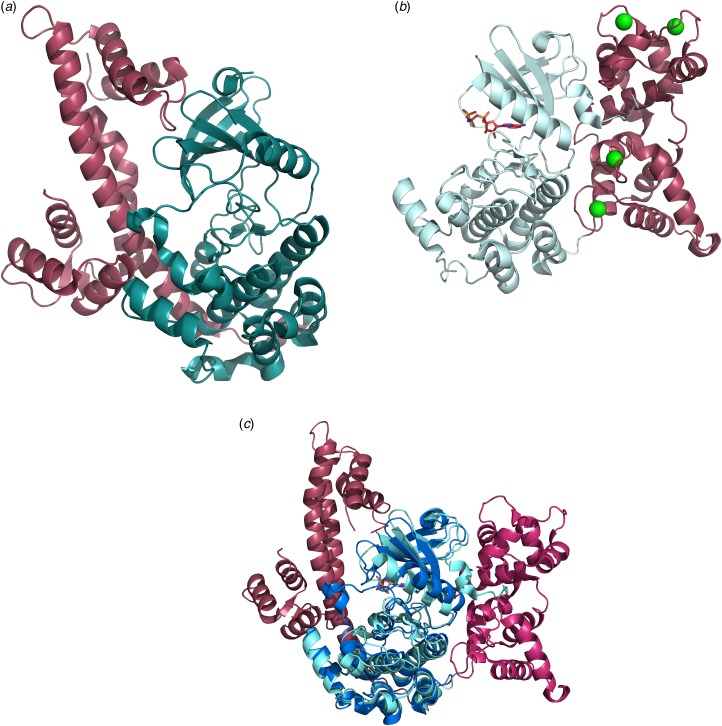
Fig. 1.
Ribbon representation of the crystal structure of CDPK1 from T. gondii with the kinase domain depicted in cyan, the regulatory domain in raspberry red. (a) CDPK1 in its inactive auto-inhibited state (PDB code: 3KU2) (Wernimont et al. 2010). (b) CDPK1 in its calcium-bound, activated state with the Ca2+-ions shown as green spheres and the non-hydrolysable ligand ANP in stick representation (PDB code: 3HX4) (Wernimont et al. 2010). (c) Ribbon diagram of the least-squares superposition of the inactive and active forms of TgCDPK1 with the kinase domains shown in cyan (active) and blue (inactive), the regulatory domain in shades of red, respectively. Only the kinase domain was used to calculate the transformation matrix, which was then applied to the entire protein chain. CDPKs, calcium-dependent protein kinases.

