
Figure 2.
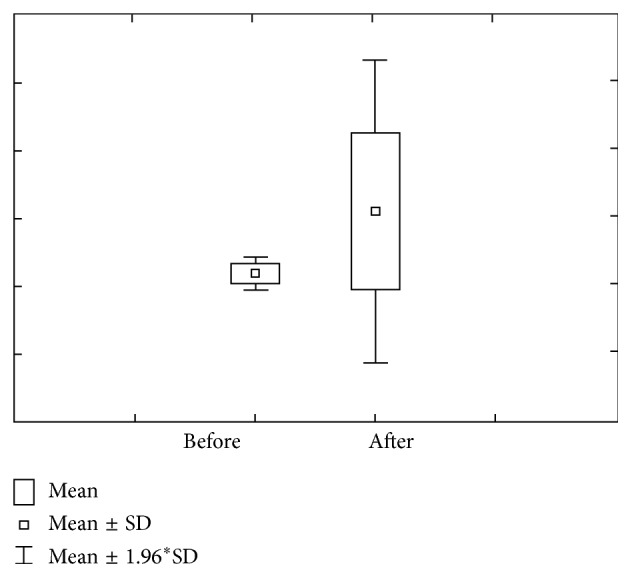
Concentration and quantity of Ca after stimulation for the first group of investigated subjects (DMF = 0).
Official websites use .gov
A
.gov website belongs to an official
government organization in the United States.
Secure .gov websites use HTTPS
A lock (
) or https:// means you've safely
connected to the .gov website. Share sensitive
information only on official, secure websites.
Concentration and quantity of Ca after stimulation for the first group of investigated subjects (DMF = 0).