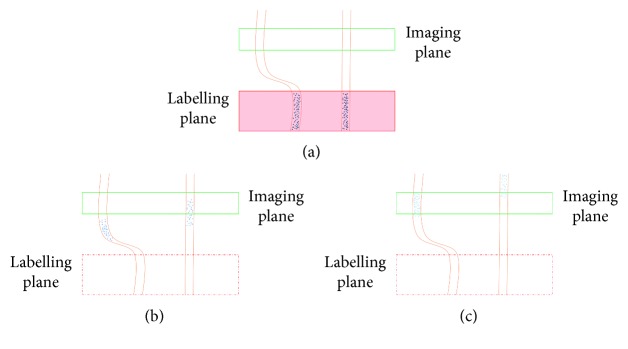
Figure 13.
A drawing showing various arterial arrival times depending on the vessel structure (a) during labelling, (b) during the first transit time after labelling, and (c) during the second transit time following labelling. Notice how the tagged bolus loses tagging via T1 decay, which is displayed as a lightening of shade.

