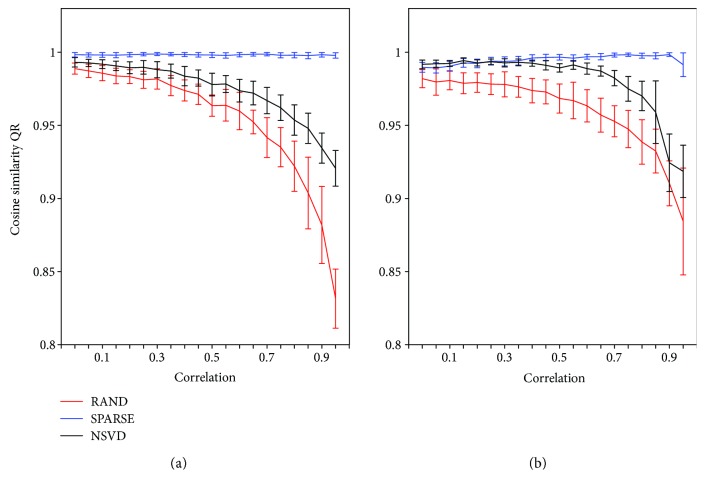
Figure 3.
Performance of NNMF with three different initialization techniques. Average cosine similarity between the synergies extracted from an initialization technique and the original simulated synergies W. For each of the 20 correlation levels between the activation coefficients C, the performance is reported as median ± median absolute deviation across 100 realizations. (a) Data generated with independent synergy vectors W I. (b) Data generated with dependent synergy vectors W D.

