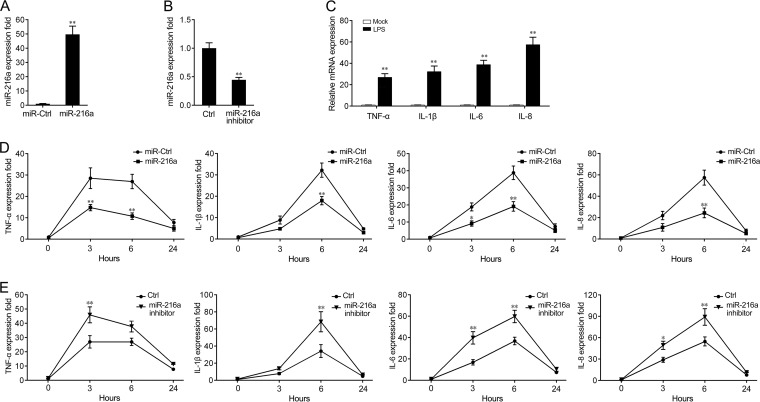
FIG 3.
miR-216a suppresses the mRNA expression of LPS-induced TNF-α, IL-1β, IL-6, and IL-8. (A and B) Miiuy croaker macrophages were transfected with control mimics (miR-Ctrl) or miR-216a mimics (miR-216a) (A) and the miR-216 inhibitor or control inhibitor (Ctrl) (B) at a final concentration of 100 nM. At 24 h posttransfection, miR-216a expression was measured by quantitative reverse transcription-PCR, and the level of expression was normalized to that of 5.8S rRNA. (C) After 3 h of LPS stimulation of miiuy croaker macrophages, the levels of expression of TNF-α, IL-1β, IL-6, and IL-8 were determined by qPCR and normalized to the level of expression of β-actin in each sample. (D and E) Miiuy croaker macrophages were transfected with miR-216a mimics (miR-216a) or control mimics (miR-Ctrl) (D) and the miR-216a inhibitor or the control inhibitor (Ctrl) (E). After 24 h, the cells were stimulated with LPS for 3 h, 6 h, and 24 h, and the expression levels of TNF-α, IL-1β, IL-6, and IL-8 were analyzed by quantitative reverse transcription-PCR. Results are standardized to those for the control cells, for which the results were given a value of 1. Data are presented as the means ± SEs from three independent experiments performed in triplicate. **, P < 0.01 versus the controls; *, P < 0.05 versus the controls.

