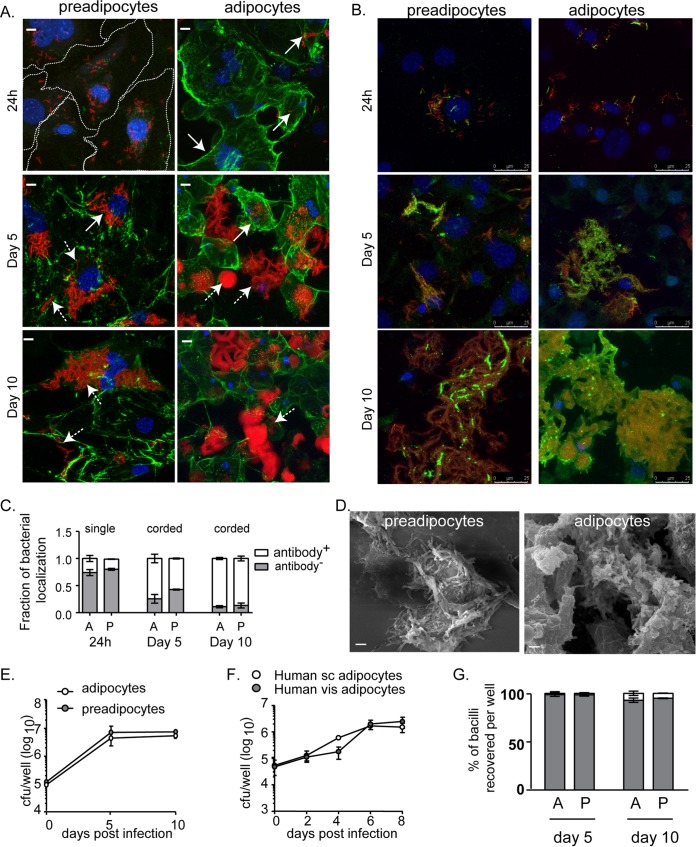
FIG 1.
Adipocytes and preadipocytes provide a growth-permissive environment for M. tuberculosis H37Rv. (A and B) Maximum-intensity projection of a confocal z-stack of 3T3L1 preadipocytes and adipocytes infected with H37Rv-mCherry (red) for the indicated time points. Cell surfaces were labeled by immunostaining for collagen (A) and M. tuberculosis lipoarabinomannan (B) (green). Nuclei were stained with DAPI (blue). Extracellular and intracellular bacilli are indicated by dashed- and solid-line arrows, respectively. Bars in panel A, 10 μm. (C) Quantification of M. tuberculosis LAM-specific staining. Data for 24-h infection (left) represent single bacteria (∼350), while those for day 5 (center) and day 10 (right) are from cords (∼130), since no single bacilli were observed. Data are means ± standard errors of the means for three independent experiments. A, adipocytes; P, preadipocytes. (D) Scanning electron micrographs of infected cells at day 10. Bars, 2 μm. (E). Growth kinetics of H37Rv in 3T3L1 preadipocytes and adipocytes. Data are means ± standard deviations for three wells and represent the results of five experiments. (F) Growth kinetics of H37Rv in adipocytes derived from human subcutaneous (sc) and visceral (vis) fibroblasts. Data are means ± standard deviations for three wells. (G) Percentages of bacilli (CFU) per well isolated from the cell lysate (shaded) and medium (open) fractions at the indicated time points after infection of adipocytes and preadipocytes. Data are means ± standard deviations for three wells and represent the results of five experiments.

