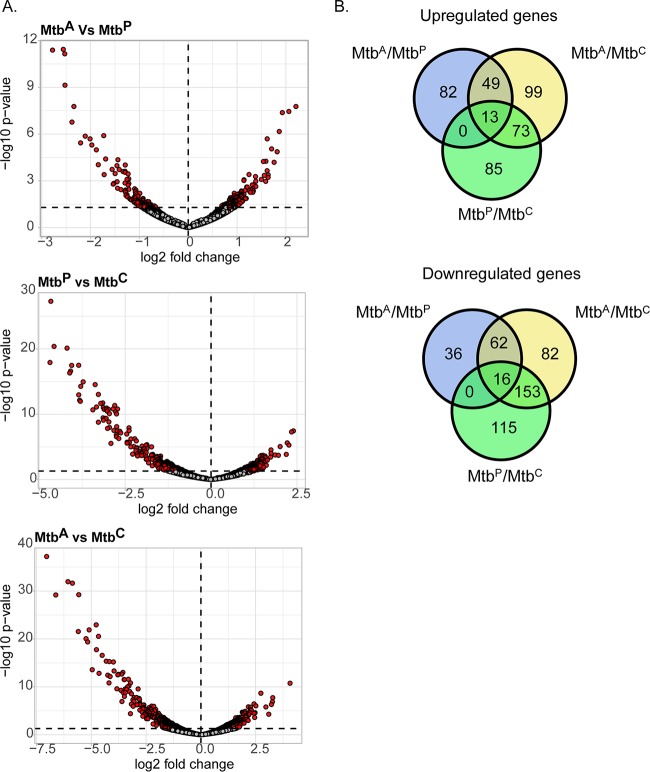
FIG 2.
RNA sequencing and analysis of differential gene expression of M. tuberculosis in adipocytes. (A) Volcano plots showing differentially expressed genes (P < 0.05) (red circles) of M. tuberculosis grown in each pairwise comparison. (B) Venn diagrams showing the numbers of genes that are common or mutually exclusive across all pairwise comparisons.

