FIG 4.
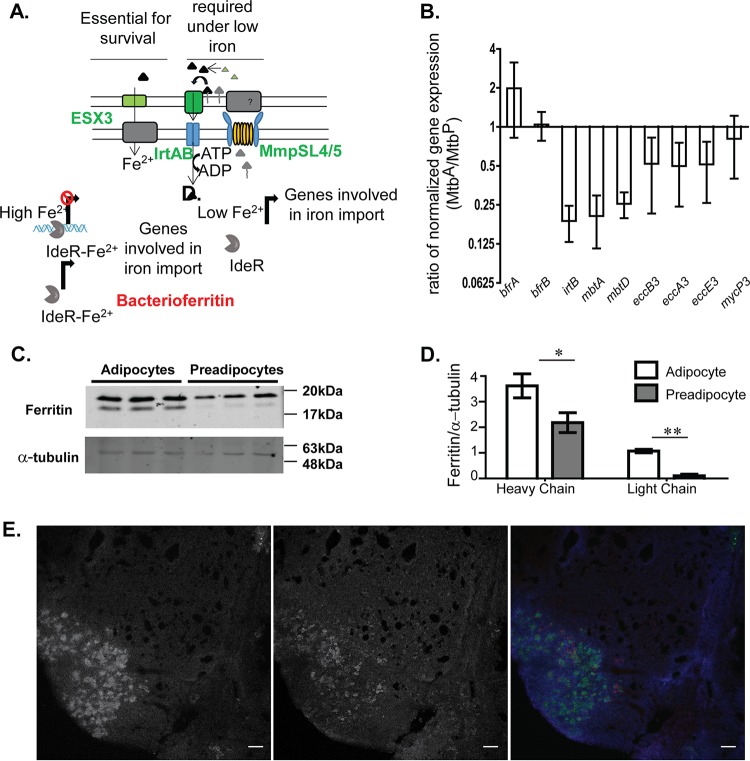
Iron homeostasis of M. tuberculosis in adipocytes relative to that in preadipocytes. (A) Schematic representation of the iron homeostasis pathway in M. tuberculosis. (B) qRT-PCR-based validation of iron-regulated genes of M. tuberculosis showing fold changes in the normalized gene expression of bacilli growing in adipocytes from that of bacilli in preadipocytes 10 days postinfection. Data are means ± standard errors of the means for three independent experiments. (C) Immunoblotting of adipocytes and preadipocytes with anti-ferritin and anti-α tubulin. (D) Quantitation of ferritin and α-tubulin in adipocytes and preadipocytes. Data are means ± standard deviations for three wells. *, P < 0.05; **, P < 0.01. (E) Differential ferritin levels in lipid-rich regions of the mouse granuloma. (Left) Bodipy 493/503 staining; (center) immunofluorescence signal for ferritin; (right) pseudocolored merge where blue indicates DAPI staining, green indicates Bodipy 493/503 staining, and red indicates ferritin immunofluorescence. Bars, 100 μm.

