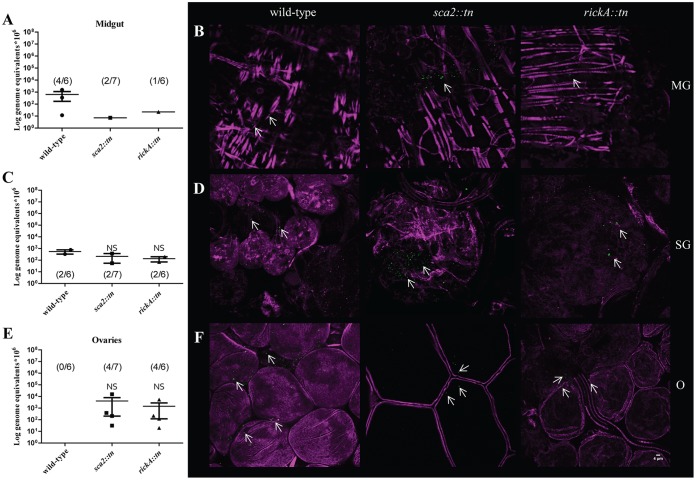
FIG 8.
Dissemination of R. parkeri wild type, sca2::tn, and rickA::tn at 7 dpe. (A, C, and E) Mean rickettsial load as quantified by qPCR for the midgut (A), salivary glands (C), and ovaries (E). Inset values represent the number of infected ticks over the number of total ticks tested via qPCR. (B) Confocal microscopy of midgut (B, top), salivary glands (D, middle), and ovaries (F, bottom), corresponding to the data presented in panel A for R. parkeri wild-type (left), sca2::tn (center), and rickA::tn (right) strains. All tissues were stained for Rickettsia (green) and actin (magenta). Statistical analysis consisted of a one-way ANOVA followed by Tukey's post hoc analysis, with a P value of <0.05 considered significant (denoted by an asterisk). Error bars represent the SEM. The mean is represented by the bar between the SEM. NS indicates nonsignificant data sets compared to wild-type data. Data and images are representative of 2 independent experiments. White scale bar, 4 μm. Arrows indicate rickettsiae.

