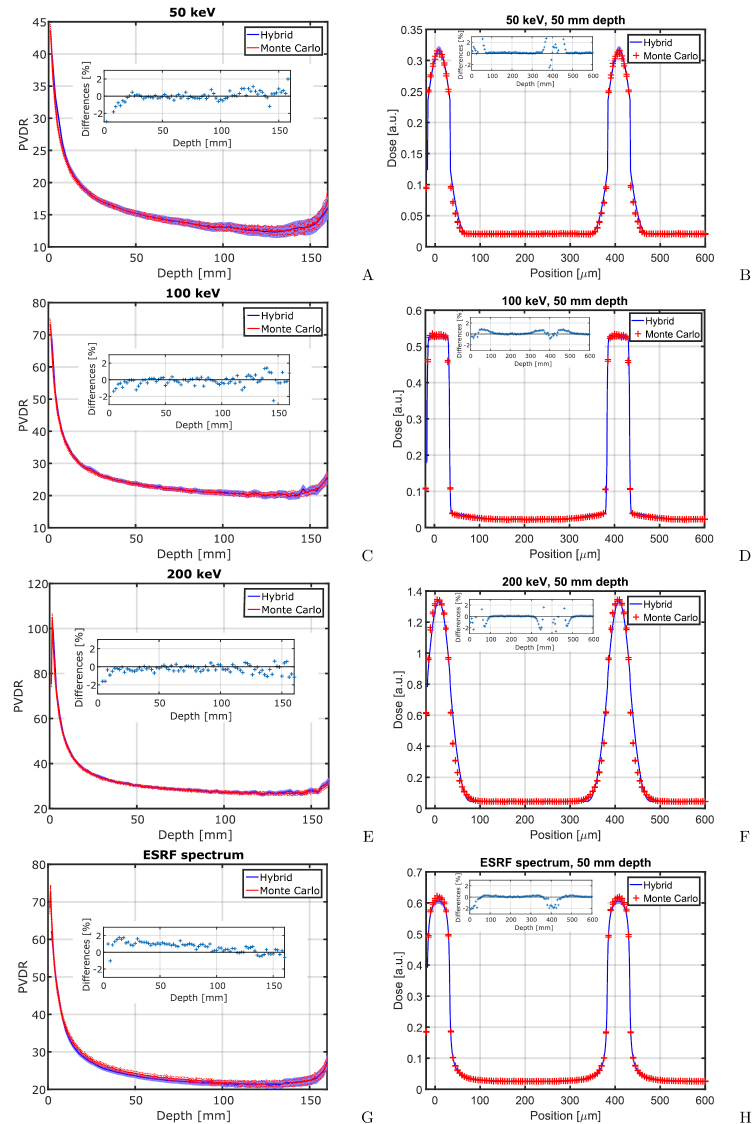
Figure 3.
The figure shows the PVDR over depth (left column) and the profiles of planar microbeams at 50 mm depth. Calculations with the hybrid algorithm (solid line) are compared to pure Monte Carlo calculations (‘+’) for 50 keV, 100 keV and 200 keV microbeams, and microbeams with the ESRF spectrum in the first, second, third and fourth rows, respectively. Small inserts show relative differences between the Monte Carlo and hybrid algorithm. They are positive if the Monte Carlo results are larger than values calculated with the hybrid algorithm. 95% confidence intervals are provided for all calculations that involve Monte Carlo simulations.

