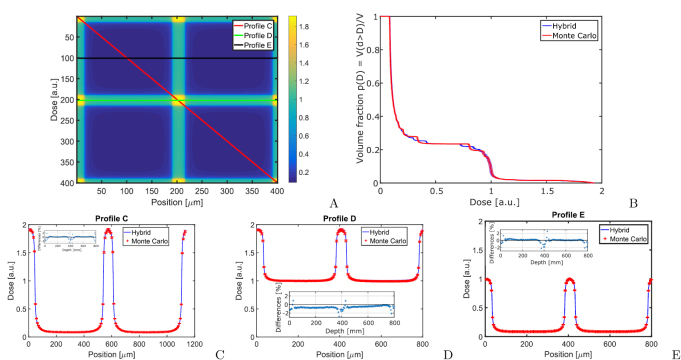
Figure 5.
The figure shows the dose distribution in the cross firing region of two microbeam fields with planar microbeams of 50 μm width and 400 μm spacing. A shows a colour scale overview, while (B) presents the DVH in the displayed cross firing region. Figures (C)–(E) show the dose profiles according to (A). Small inserts show the relative differences between the Monte Carlo and hybrid algorithm.

