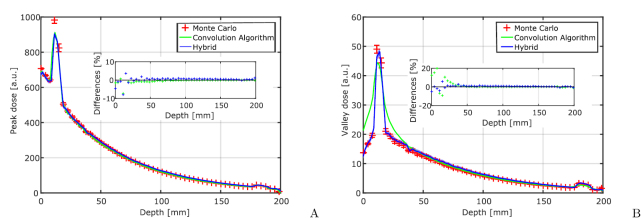
Figure 7.
The figure shows peak (A) and valley (B) doses for a mm microbeam field that was irradiated into an anthropomorphic head phantom. Doses were calculated with Monte Carlo simulations, the convolution algorithm and the hybrid algorithm. Error bars for the Monte Carlo simulations indicate 95% confidence intervals. Small inserts show relative differences between the Monte Carlo and hybrid algorithm.

