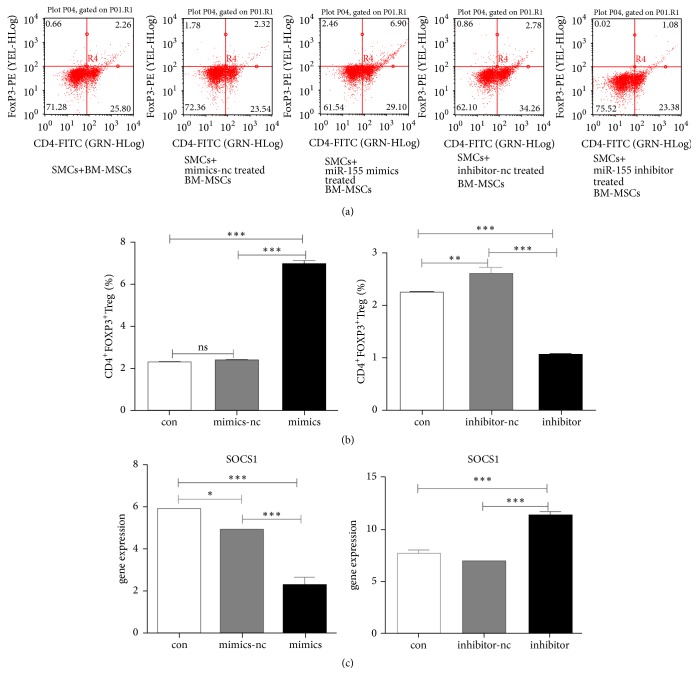
Figure 4.
Effect of BM-MSCs miR-155 levels on CD4 + FOXP3 + Treg cells. (a) The proportions of CD4+FOXP3+Treg cells in SMCs incubated in the absence and/or presence of BM-MSCs. (b) Quantification of CD4+FOXP3+Treg cells in SMCs. (c) Overexpression and/or inhibition of miR-155 affected SOCS1 mRNA levels in SMCs. ∗p < 0.05, ∗∗p < 0.01, and ∗∗∗p < 0.001.

