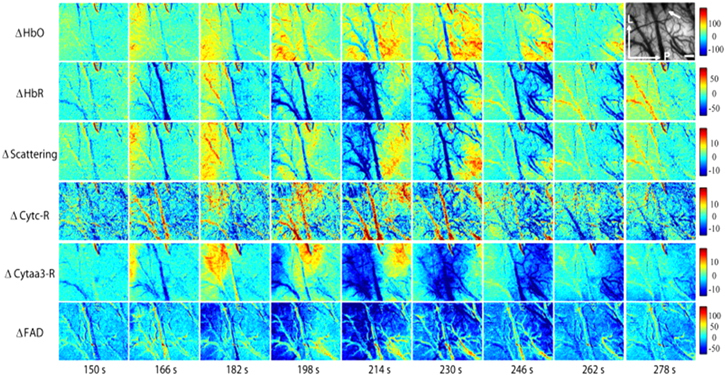
Figure 10.

Spatial maps of the relative changes in concentration of HbO2 (first row), HHb (second row), scattering (third row), reduced cytochrome c (fourth row), redCCO (fifth row) and FAD (sixth row) in the exposed cortex of a rat, at different temporal intervals during and after CSD. The top-right figure represents the reflectance image at 570 nm. Scale bar (in white) equal to 0.5 mm. Reprinted from [95], Copyright (2013), with permission from Elsevier.
