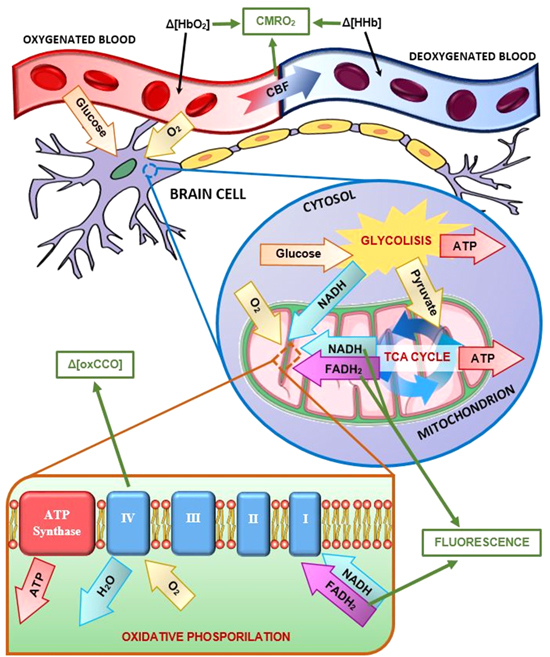
Figure 2.

Diagram of the major metabolic pathways in brain tissue. Key metabolites and processes are reported, and related optical signals and parameters (in green squares) can be measured and estimated using different HSI approaches: namely, quantification of CMRO2, detection of fluorescence from NADH and FAD, plus monitoring of the redox states of CCO.
