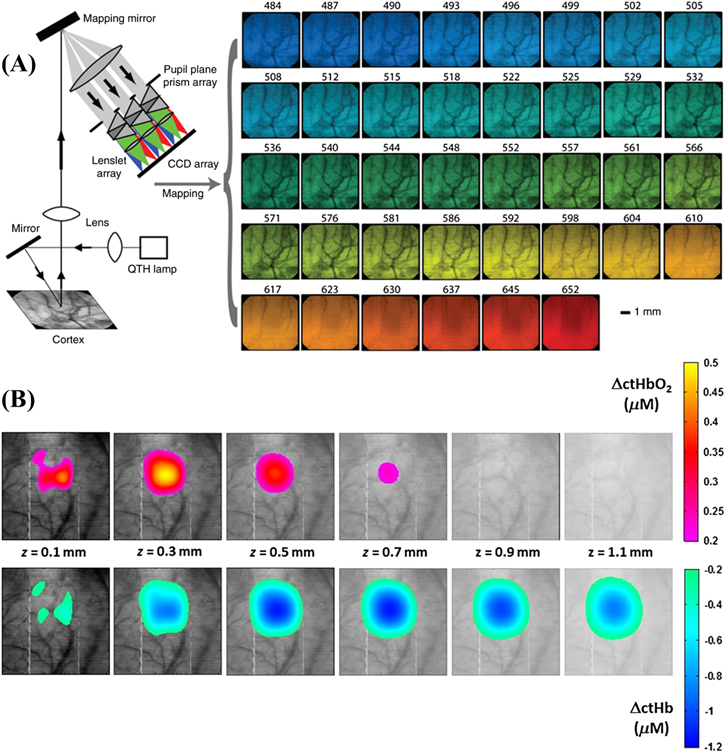
Figure 5.

(A) Snapshot HSI setup used to image rat somatosensory expose cortex at 38 spectral bands during a single 50 ms exposure. The 2D images for each wavelength were obtained using mapping reconstruction from dispersed light though a prism array. (B) The changes in concentration of HbO2 and HHb were reconstructed using a Rytov tomographic algorithm to generate cross-sections of the hemodynamic response at different depths z in brain tissue after 4 s post-stimulus. Reproduced with permission from [91].
