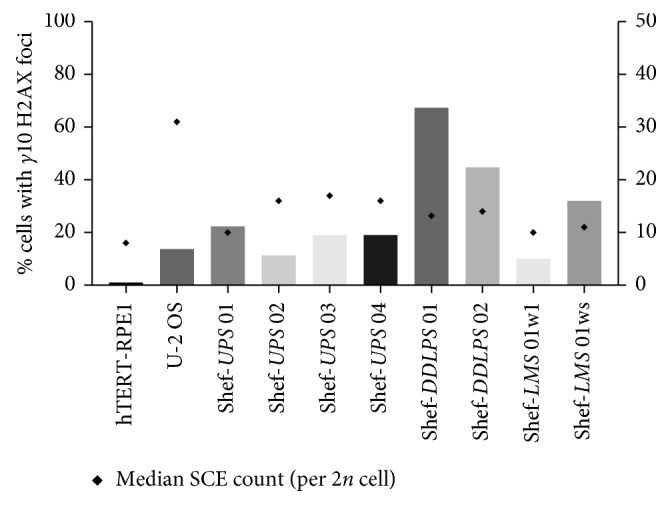
Figure 3.

Endogenous γH2AX foci and sister chromatid exchange analysis in sarcoma cell lines. No relationship was seen between the frequency of endogenous γH2AX foci (bars) and SCE (corresponding black dots) among sarcoma cell lines (Spearman's r2=0.029; p=0.99). All nine cell lines however showed high frequency of endogenous γH2AX foci and SCE, compared with nontumour control hTERT-RPE1 cells that had no cells with more than 10 endogenous γH2AX foci. Bars plotted along the left y-axis represent the percentage of 100 randomly selected cells in each corresponding cell line with >10 endogenous γH2AX foci, and data are shown as the mean of 3 independent repeat experiments. Black dots plotted along the right y-axis represent the median SCE counts from 10 to 30 metaphase chromosome spreads. The SCE counts were normalised for a diploid (2n) karyotype by multiplying the number of observed SCE by 46 and then dividing by the observed chromosome number.
