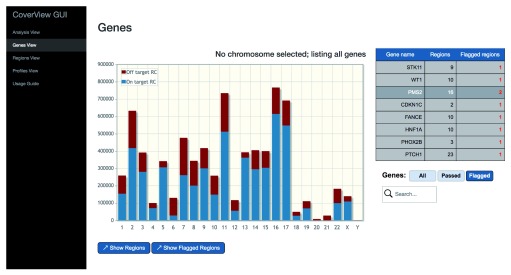
Figure 1. CoverView GUI Genes View for TSCP analysis in GIAB sample.
CoverView GUI screenshot of the Genes View for TruSight Cancer Panel (TSCP) data generated for the Genome in a Bottle (GIAB) sample shows a bar plot of per-chromosome read counts and the list of flagged regions. Nine regions in eight genes were flagged for falling below MINQCOV ≥50 in the GIAB sample.

