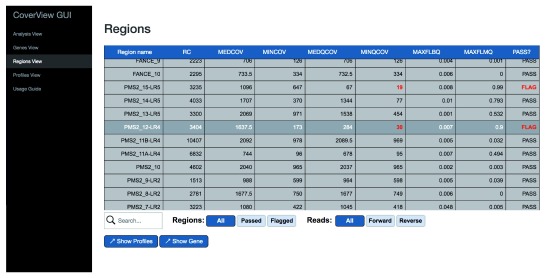
Figure 2. CoverView GUI Regions View for PMS2 in GIAB sample.
CoverView GUI screenshot of Regions View for PMS2 data in the GIAB sample showing the summary metrics per region. Metrics that fall below user-defined thresholds are shown in red and flagged. The MINQCOV for PMS2 exons 12 and 15 are below MINQCOV ≥50.

