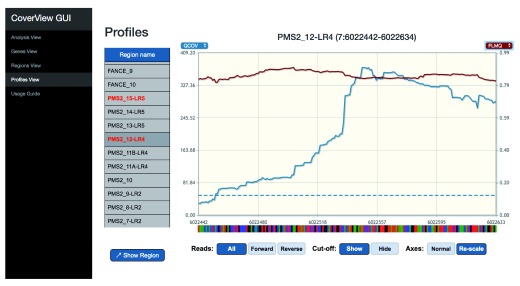
Figure 4. CoverView GUI Profiles View showing PMS2 exon 12 QCOV and FLMQ data in GIAB sample.
CoverView GUI screenshot of Profiles View for PMS2 exon 12 data in the GIAB sample showing the quality coverage QCOV (blue), fraction of read bases with low mapping quality FMLQ (red) and the minimum QCOV threshold as dashed horizontal lines, across the region. This shows that the majority of reads mapping to this region have low mapping quality.

