Fig. 5.
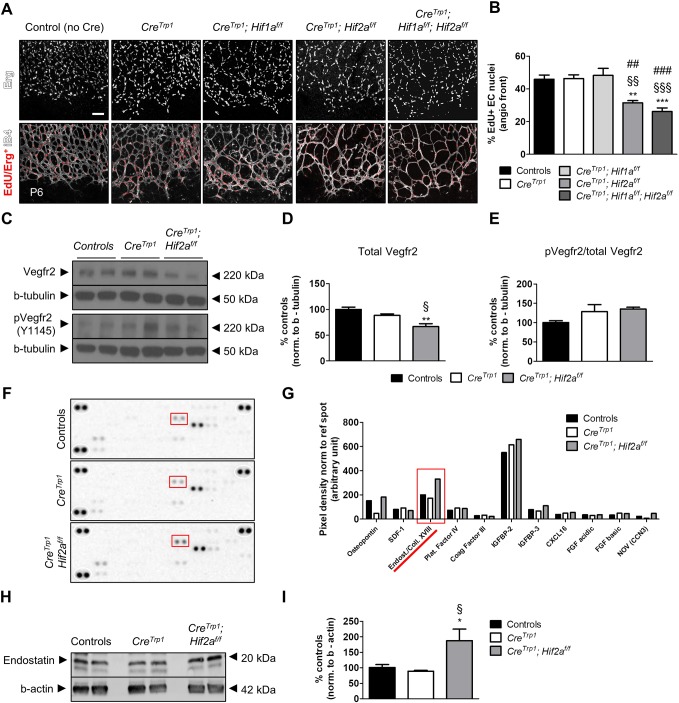
Hif2a KO lines show reduced endothelial cells division, normal Vegfr2 activation and increased endostatin levels. (A) EdU inclusion in endothelial cell nuclei (stained with Erg antibody) at the angiogenic front (age: P6). (B) Quantification of the data shown in A. n=5; 4 fields/animal quantified. ANOVA and Tukey's multiple comparison test: **P<0.01, ***P<0.001 vs controls; §§P<0.01, §§§P<0.001 vs CreTrp1; ##P<0.01, ###P<0.001 vs CreTrp1;Hif1af/f. (C) Representative western blot of whole retina lysates (age: P5) probed for total Vegfr2, phosphorylated Vegfr2 (Y1145) and β-tubulin. (D,E) Densitometry of quantification of total Vegfr2 (D) and the ratio of pVegfr2 over total Vegfr2 (E). Values are expressed as percentage relative to controls; n=4-6. ANOVA and Tukey's multiple comparison test: **P<0.01 vs controls; §P<0.05 vs CreTrp1. (F) Angiogenesis proteome profiler array of P6 whole retina lysates (pooled n=10 retinae). (G) Densitometry of spot pixels for different analytes detected in F. Red boxes in F and G highlight endostatin/collagen XVIII spots and pixel densities, respectively. (H) Representative western blot of whole retina lysates (age: P6) probed for endostatin and β-actin. (I) Densitometry of endostatin bands in H, normalized to β-actin. Values are expressed as percentage relative to controls; n=4-6 animals. ANOVA and Tukey's multiple comparison test: *P<0.05 vs. controls; §P<0.05 vs CreTrp1. Scale bar: 10 µm.

