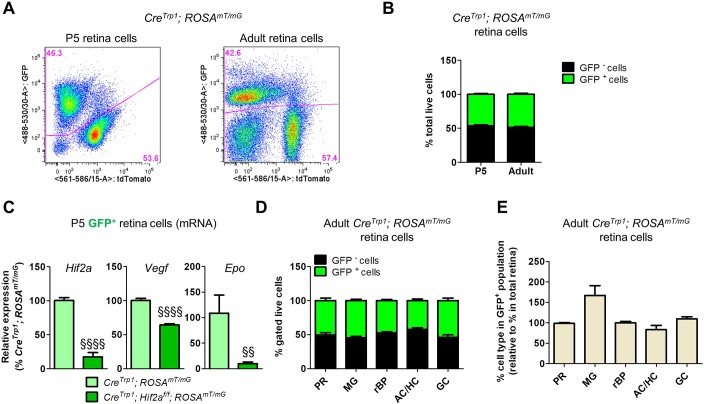
Fig. 6.
Characterization of neuroretina cells expressing Cre recombinase in the CreTrp1 line. (A) Representative flow cytometry (P5 and young adult) of CreTrp1;ROSAmT/mG. (B) Quantification of total live GFP+ and GFP− cells in CreTrp1;ROSAmT/mG retinae. n=24-52 animals/age. (C) RT-qPCR analysis of Hif2a, Vegf and Epo expression in GFP+ cells FACS-sorted retina cells from P5 CreTrp1;ROSAmT/mG. n=6-7. ANOVA and Tukey's multiple comparison test: §§P<0.01, §§§§P<0.0001 vs CreTrp1;ROSAmT/mG. (D) Quantification of GFP+ and GFP− cells for each subpopulation analysed by flow cytometry on adult dissociated CreTrp1;ROSAmT/mG retinae. Please refer to Tables S1 and S2 for markers and reference percentages. (E) Histogram comparing the composition of the GFP+ subpopulation with the composition of the whole retina of adult CreTrp1;ROSAmT/mG mice (values expressed as percentage of the total retina composition). n=5-9. AC, amacrine cells; GC, ganglion cells; HC, horizontal cells; MG, Müller glia; PR, photoreceptors; rBP, rod bipolar cells.

