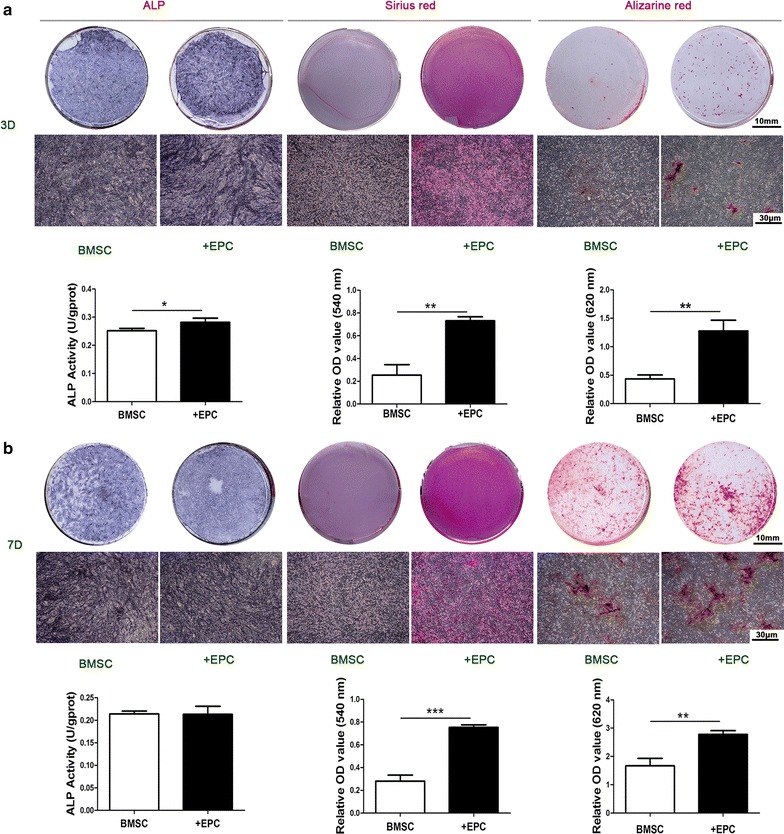
Fig. 2.

ALP staining, ALP activity, collagen secretion and ECM mineralization of cell sheets after osteogenic differentiation. ALP staining, intracellular ALP activity, collagen secretion, ECM mineralization and the quantitative colorimetric results of cell sheets after 3 (a) and 7 days (b) of osteogenic induction. Representative macroscopic view is shown in the upper panels and microscopic view (×40) is shown in the lower panels. Data are shown as mean ± SD and analyzed by Student t-test, n = 3; *p < 0.05, **p < 0.01 and ***p < 0.001
