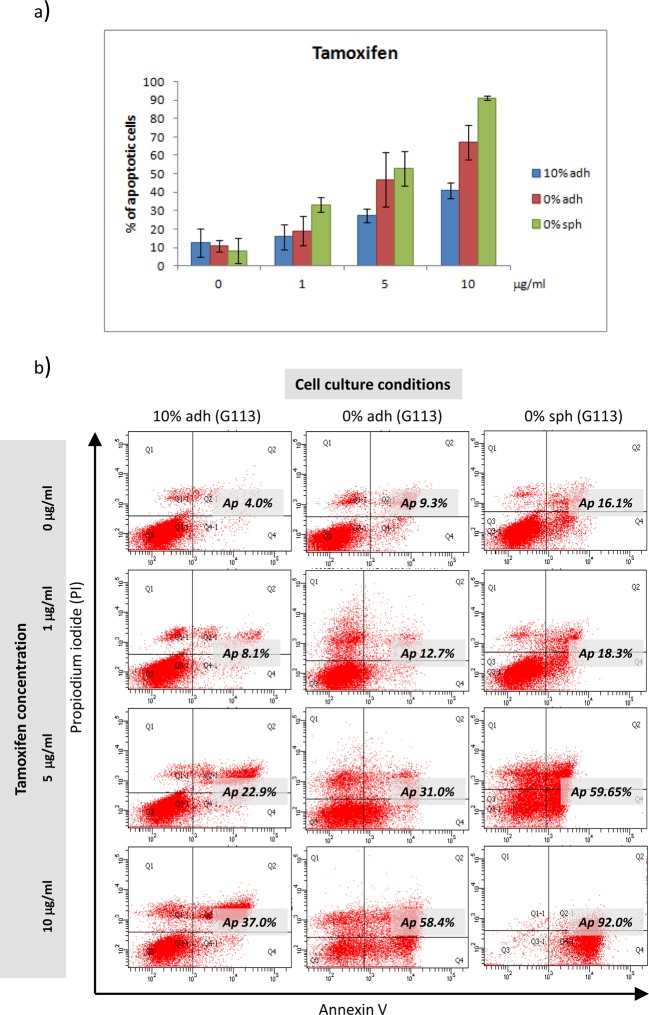
Figure 6. Apoptotic response in three different types of culture of glioblastoma cells treated with tamoxifen.
(a) Quantitative analysis revealed differences in the apoptotic response of glioblastoma cells cultured in different conditions observable at higher drug concentrations. Each bar represents the mean percentage (±SD) of pooled data of apoptotic cells yielded from all three tumours (G113, G114 and G116) cultured under the same conditions (10% adh, 0% adh, 0% sph). (b) Sample results (the G113 culture) of the FACS analysis demonstrating the extent of apoptosis/necrosis measured by annexin V-FITC/PI staining for control cells and three concentrations of drug under three culture conditions.

