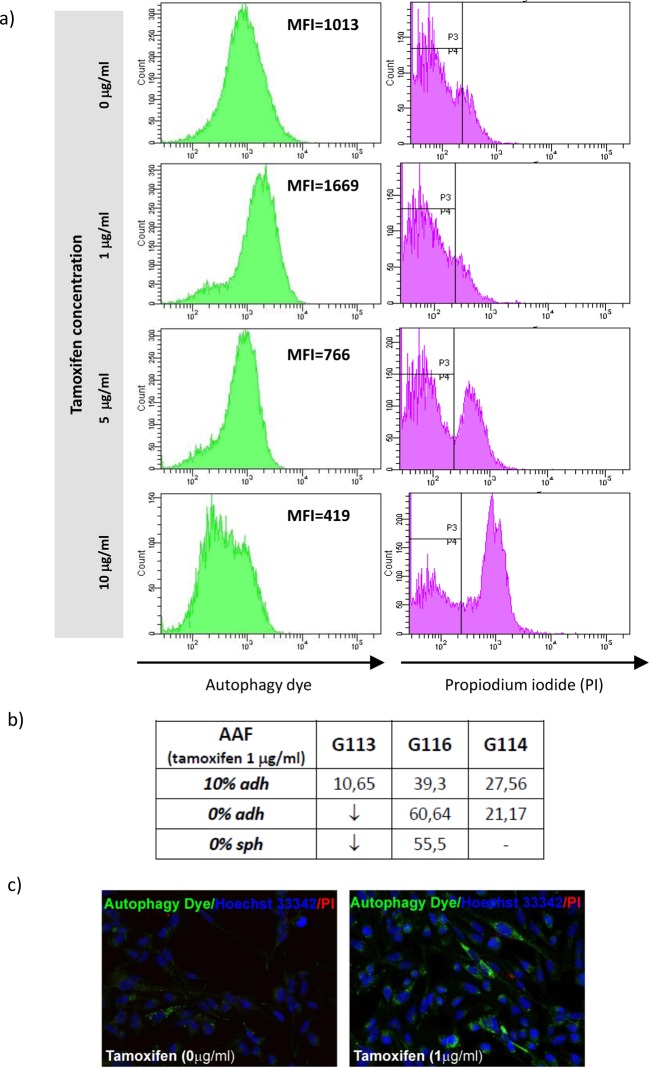
Figure 8. Autophagy status in glioblastoma cells subjected to tamoxifen treatment.
Results of FACS analysis demonstrated intensification of autophagy
process (showed as mean fluorescence intensity – MFI) only at the
lowest drug concentration. Application of higher drug doses resulted in
silencing of this process and increasing percentage of necrotic cells
detected by means of the PI accumulation. (a) The sample
results of FACS analysis (G116 culture, 10% adh) based on
autophagic vacuoles labelling and PI staining for control cells and the
cells treated with increasing tamoxifen concentration. (b)
The results reflecting autophagy intensity following the administration
of the lowest dose of tamoxifen in particular glioblastoma cultures.
Data are expressed as AAF calculated according to the equation:  . ↓ - the intensity of autophagy
below the level detected in control. (c) Fluorescence
microscopy images of control and drug-treated cells confirming the
staining capability of autophagy dye (green detection reagent) used for
FACS analysis.

