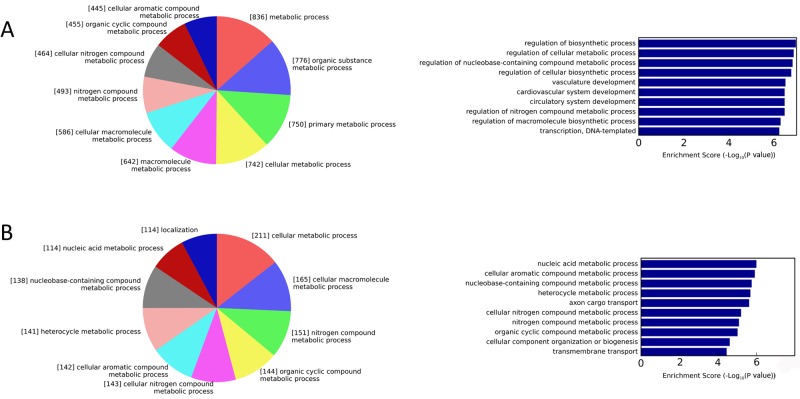
Figure 3. Functional annotations of target genes.
Biological process categories of target genes of low-abundance miRNAs (A) and high-abundance miRNAs (B) in the GO analysis. The numbers shown in each section of the pie chart represent the number of putative target genes mapped to the corresponding GO terms. Bar graphs show the −log10 (P-value) of each GO term.

