
Figure 2.
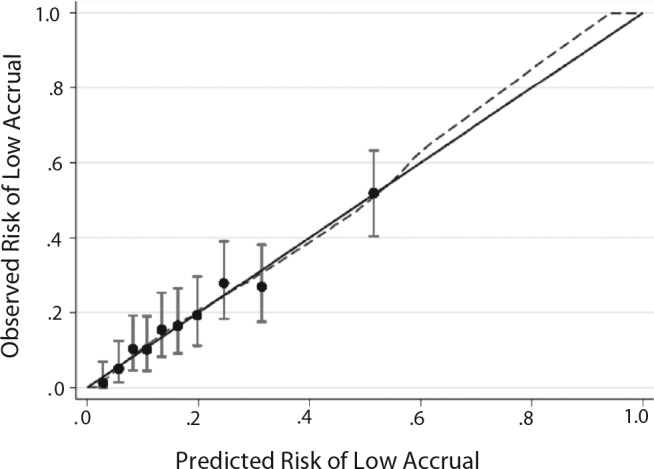
Calibration plot for cooperative group-sponsored trials registered in ClinicalTrials.gov and started between 2000 and 2011. The calibration figure shows the average risk of poor accrual for trials grouped into deciles by their predicted risk (x-axis) compared with the actual percentage of trials in these groups that experienced poor accrual (y-axis). Vertical lines correspond to 95% confidence intervals. Perfect calibration would fall on the 45-degree diagonal line where predicted risks equal observed rates of poor accrual. χ2 for Hosmer-Lemeshow goodness-of-fit test was 3.36 (P = .97)