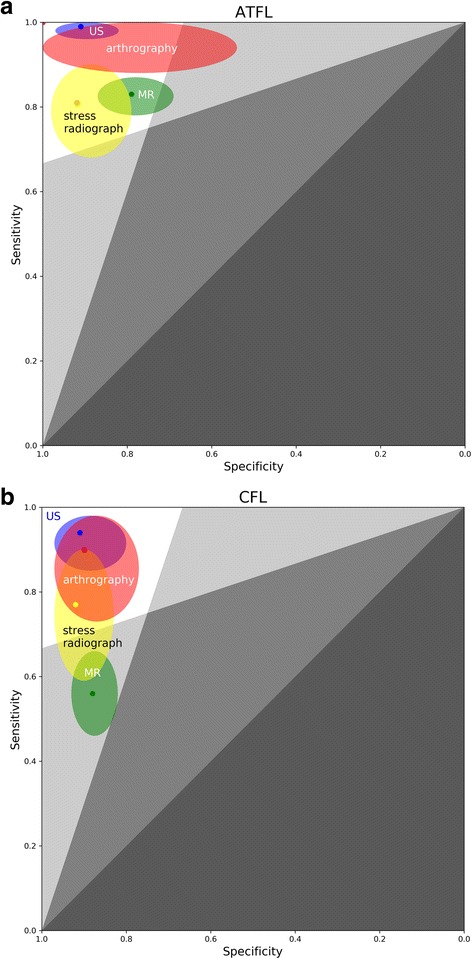
Fig. 4.

Zones of mostly bad imaging efficacy (ZOMBIE) plot for ATFL (a) and CFL (b). This is based on the receiver operating characteristic (ROC) plot. The colored dot stands for pooled sensitivity and specificity of each imaging technique, and the colored oval stands for 95% confidence interval of each imaging technique (green, MR; blue, US; red, arthrography; yellow, stress radiograph). Upper-left boomerang-shaped area formed by white and light grey zones defines zone of acceptable efficacy. Upper arm of the boomerang-shaped area stands for negative likelihood ratio below 0.33. Left arm of the boomerang-shaped area stands for positive likelihood ratio above 3
