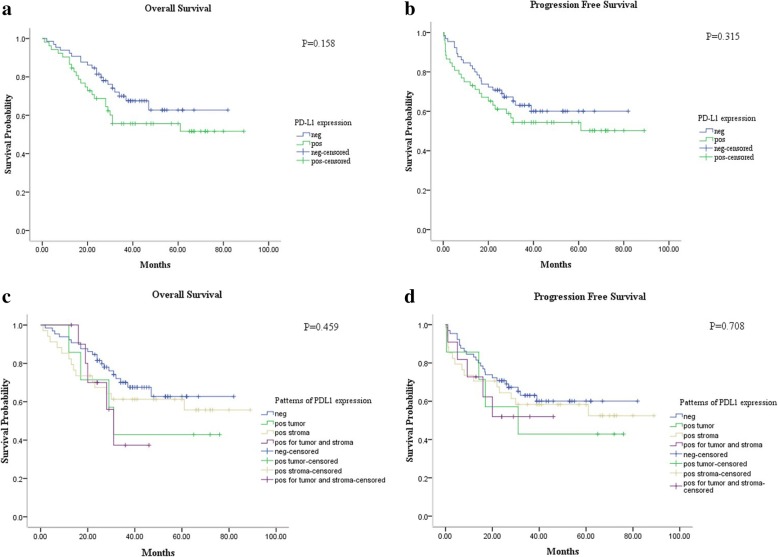
Fig. 2.
Kaplan-Meier survival curves of OS and PFS for PD-L1 were performed. The PD-L1 expression has a trend with decreased OS (p = 0.158) (a) and PFS (p = 0.315) (b) but did not reach the significant level. Similarly, the PD-L1 positive target cells were further classified as tumor cells and immune cells. We found that expression on tumor cells seemed to have poorer OS (p = 0.459) (c) and PFS (p = 0.708) (d) than in immune cells

