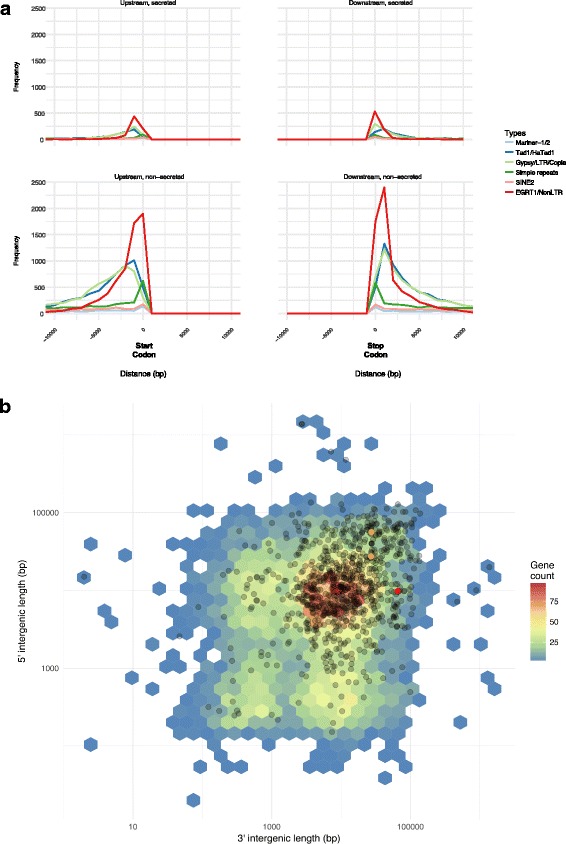
Fig. 4.

Intergenic space has similar size and is occupied by TEs in case of both SPs and non-SPs. a Frequency plot of the distance (− 10,000 to + 10,000 bp) of repetitive elements from the start codon (left panel) or the stop codon (right panel) of SPs (top panels) and non-SPs (bottom panels). The lines are color-coded and each represents a class of TEs according to the given legend. b 5′ and 3′ intergenic space size (y and x-axis) was calculated using BEDTools on the DH14 reference annotation. Black dots depict the intergenic length of all SPs, colored hexagons indicate the intergenic length of all non-SPs. Note the color-code indicating the frequency distribution (gene count according to the legend on the right) of non-SPs. The orange dots mark the two AVRa1 copies and the red dot marks AVRa13
