Fig. 1.

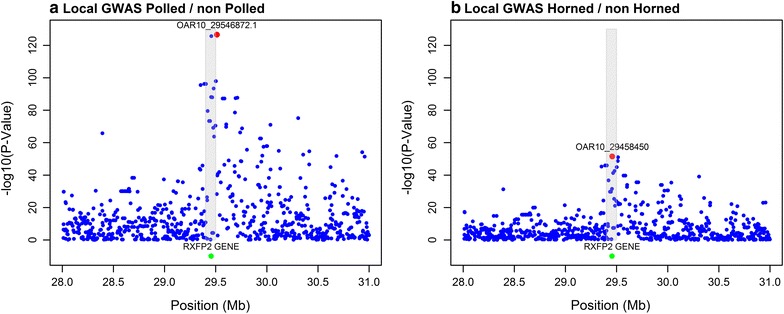
Local genome-wide association plot for the traits a polled/non-polled and b horned/non-horned of OAR10. The grey rectangle indicates the location of the RXFP2 gene (29.4–29.5 Mb). The most significant SNP is indicated in red with its name

Local genome-wide association plot for the traits a polled/non-polled and b horned/non-horned of OAR10. The grey rectangle indicates the location of the RXFP2 gene (29.4–29.5 Mb). The most significant SNP is indicated in red with its name