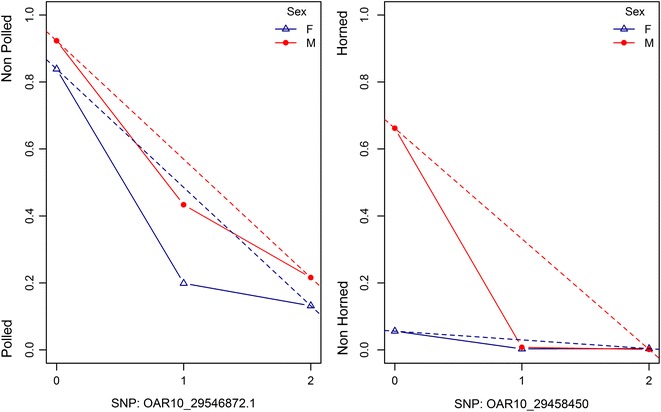
Fig. 2.

Degree of dominance per sex. a Degree of dominance for polled/non-polled. Non-polled is coded as 1 and polled as 0. The dotted line indicates an additive model, where the solid line includes dominance (best fitted model). The lines for females and males are blue and red, respectively. b Degree of dominance for horned/non-horned. Horned is coded as 1 and non-horned as 0. The dotted line indicates an additive model, where the solid line includes dominance (best fitted model). The lines and males are blue and red, respectively
