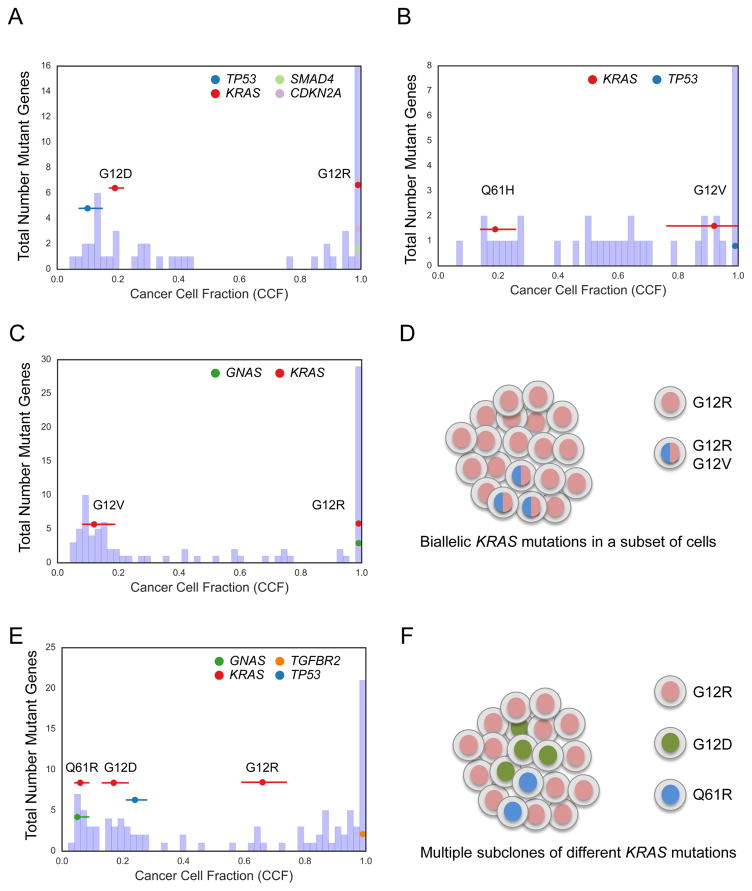
Figure 2. KRAS mutational heterogeneity.
(A–C) Histogram of cancer cell fraction (CCF) estimates (X-axis) for all identified mutated genes (Y-axis, blue bars) as well as point estimates and 95% confidence intervals for selected genes (colored horizontal lines) for a tumor (YB-A89D) with clonal KRASG12R mutation and clonal CDKN2A and SMAD4 mutations but also harboring a second apparent subclone with a KRASG12D and TP53 mutation (A), a tumor (XD-AAUG) with a clonal KRASG12V mutation and a subclonal KRASQ61H mutation (B), and a tumor (RB-A7B8) with a clonal KRASG12R mutation, a subclonal KRASG12V mutation, and a clonal GNAS mutation (C). (D) Schematic model of the tumor shown in (C) based on CCF evidence for biallelic KRAS mutations in a subset of cells. (E) Tumor (2J-AAB1) with CCF evidence of multiple subclonal KRAS alterations in the same tumor. (F) Schematic model of the tumor shown in (E) with evidence for multiple subclones, each harboring a different KRAS mutation. See also Figure S2.

