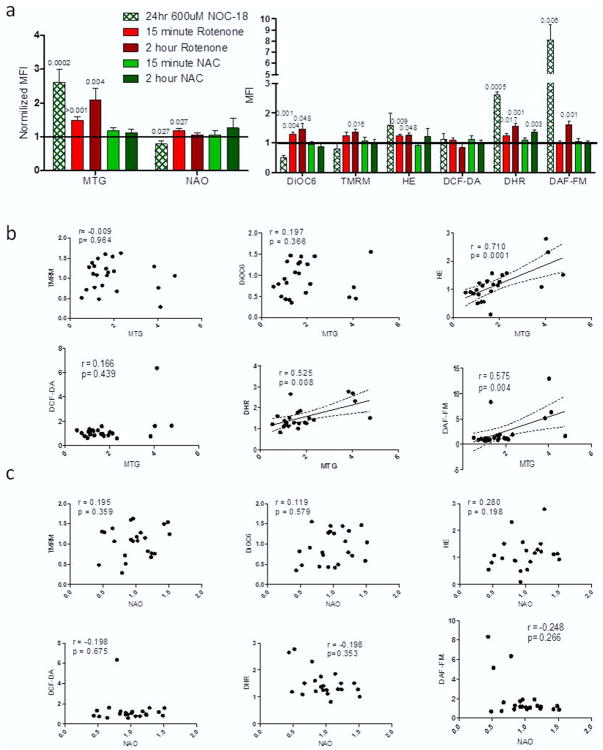
Figure 1. Mitochondrial mass dyes correlate with ROS and RNS markers.
(a) Normalized levels of mitochondrial flow dyes for each of our treatment groups from 12 experiments. P values shown are from paired t-tests with p < 0.05. (b) Correlation results comparing MTG to ΔΨm (TMRM and DiOC6), ROS markers (HE and DHR), and RNS markers (DCF-DA and DAF-FM). (c) Correlation results comparing NAO to ΔΨm (TMRM and DiOC6), ROS markers (HE and DHR), and RNS markers (DCF-DA and DAF-FM). Correlations r and p values from Spearman statistical test are shown for all graphs with statistical significance being p < 0.05.

