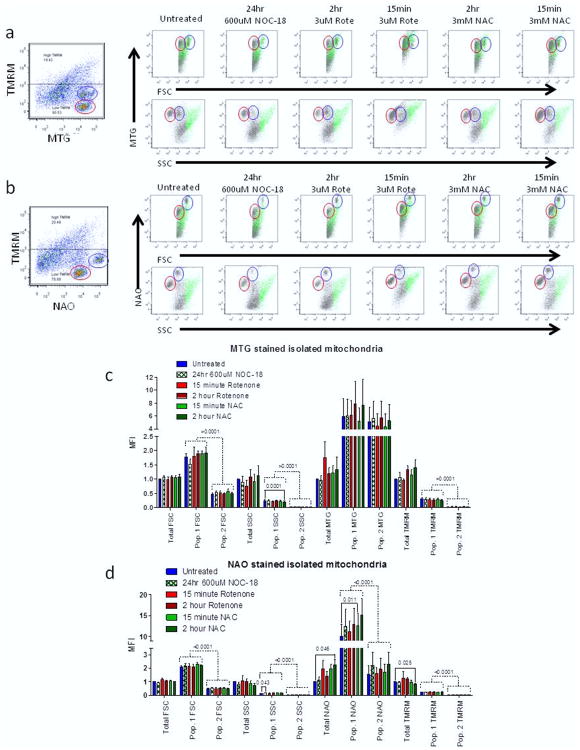
Figure 2. Isolated mitochondria have distinct subpopulations.
(a) Representative dot plots from isolated mitochondria stained with MTG and TMRM under each treatment group. (b) Representative dot plots from isolated mitochondria stained with NAO and TMRM under each treatment group. Mitochondria with high potential are shown in green, while low potential mitochondria are shown in grey. Two distinct sub populations of mitochondria are circled in blue (sub population 1) and red (sub population 2). (c) MTG stained mitochondria for total mitochondria as well as each sub population. (d) NAO stained mitochondria for total mitochondria as well as each sub populations. The t-test (solid lines) and 2-way ANOVA (dashed lines) with p < 0.05 are shown.

