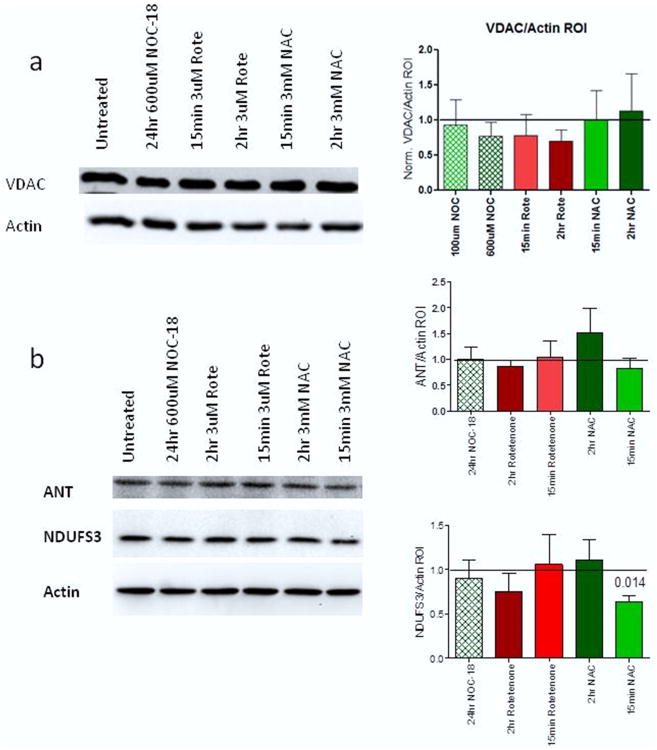
Figure 3. Mitochondrial mass proteins show decreased NDUFS3 after NAC treatment.
(a) Representative western blot and actin normalized bar chart for VDAC protein levels. (b) Representative western blot and actin normalized bar charts for ANT and NDUFS3 protein levels respectively. P values shown are from paired t-tests with p < 0.05.

