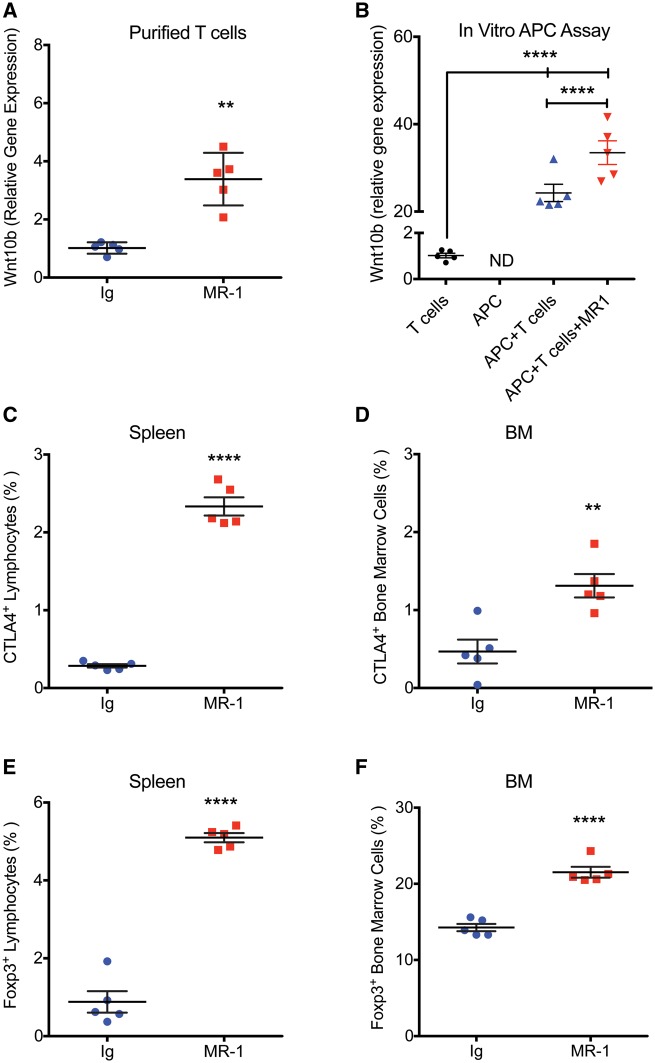
Fig. 4.
MR1 induces Wnt-10b production by T cells in an antigen-presenting cell assay and promotes Treg formation and cytotoxic T lymphocyte antigen 4 production
(A) Mice were treated with MR1 for 2 months and Wnt-10b was quantified by real-time RT-PCR in immunomagnetically purified splenic T cells. **P < 0.01 by Mann–Whitney test. (B) MHCI antigen-presenting cell (APC) assay followed by RT-PCR quantification of Wnt-10b production by CD8+ T cells alone (control), APC alone, CD8+ T cells co-cultured with ovalbumin expressing APC, treated with or without MR1 (5 μg/ml). n = 5 independent wells/group. ****P < 0.0001; by one-way analysis of variance with Tukey’s Multiple Comparison post-test. ND: not detected. (C) Cytotoxic T lymphocyte antigen 4 (CTLA-4) expression in spleen and (D) bone marrow (BM) by flow cytometry. (E) FoxP3 expression in spleen and (F) BM by flow cytometry. **P < 0.01; ****P < 0.0001; Student’s t-test. n = 5 mice/group. All data are presented as mean (s.d.). BM: bone marrow; MHCI: major histocompatibility complex I; RT-PCR: reverse transcription polymerase chain reaction.

