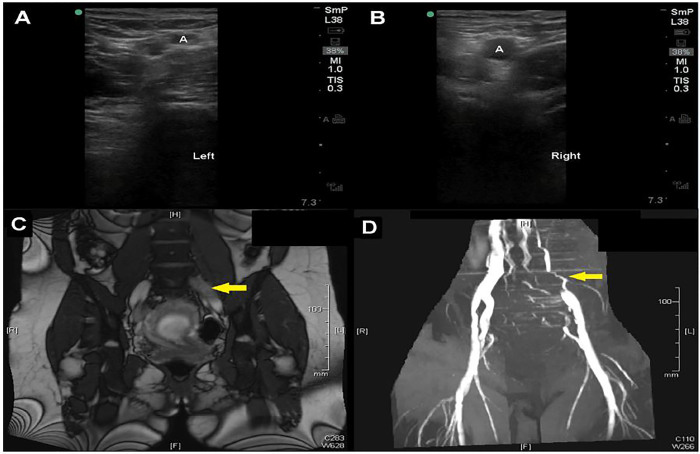
Image 2A, B.
Difficulty in compression. In panel A, venous compression is only achieved with high pressure, as noted by the compressed artery (A). Compare this to panel B, where the vein is completely compressed while the artery (A) is able to maintain a normal diameter.
Image 2C, D. Common Iliac thrombosis on magnetic resonance: venogram. In panel C, a thrombus is seen as a hypointense signal in the left common iliac vein (arrow). This finding, along with evidence of occlusion, is also evident in panel D (arrow).

