
Figure 2. Guilt-by-association Analysis.
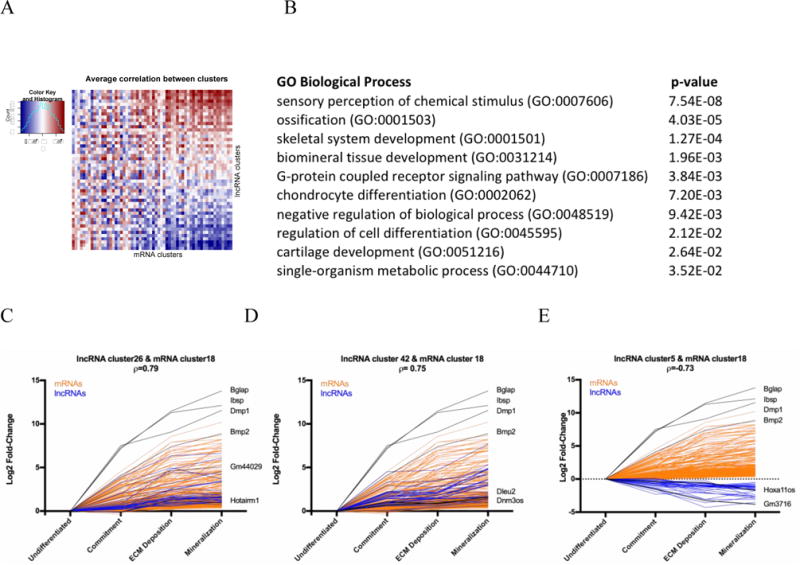
A) Association matrix of mRNAs and lncRNAs. 60 mRNA expression profile clusters (columns) and 50 lncRNA expression profile clusters (rows) are shown as positively (blue), negatively (red) or not associated (white). B) Gene ontology of the mRNAs in cluster 18 with the associated p-value. C,D) Log2 fold-change expression of mRNAs (orange) and lncRNAs (blue) across development are depicted. mRNAs in cluster18 show a highly correlative pattern of expression with lncRNA clusters 26 and 42, and a negatively correlative expression pattern with lncRNA cluster 5 (E).