
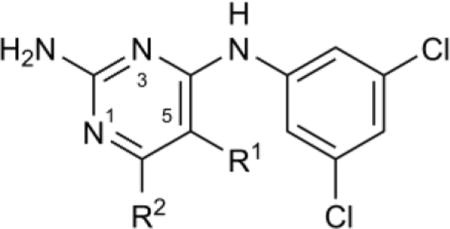
Table 1.
SAR of pyrimidine C5 and C6 positions
| ||||||
|---|---|---|---|---|---|---|
| Compound | R1 | R2 | pKa(N1)a | Tb IC50,b μM | Hs IC50,c μM | Tb427 EC50,d μM |
| 7 | H | Me | 7.3 | 3.7 (3.3–4.1) | 27% at 180 | 5.6 (4.5–7.1) |
| 8 | H | H | 6.6 | 13 (11–15) | >180 | 9.9 (7.7–13) |
| 9 | H | Et | 7.1 | 3.0 (2.7–3.3) | 36% at 180 | 4.7 (4.1–5.4) |
| 10 | H | iPr | 7.0 | 12 (10–14) | >180 | 4.7 (3.9–5.8) |
| 11 | H | Ph | 6.1 | 24% at 21 | >21 | 7.2 (6–8.5) |
| 12 | H | N-morpholino | 6.0 | >180 | >180 | 13 (10–17) |
| 13 | H | Cl | –2.2 | >180 | >180 | 8.9 (7.3–11) |
| 14 | H | CF3 | –3.3 | >180 | >180 | 10 (7.5–14) |
| 15 | −(CH2)3− | 6.8 | 12 (11–14) | >21 | 19 (15–24) | |
| 16 | Me | Me | 7.0 | 4.8 (4.5–5.2) | 25% at 180 | 17 (14–20) |
a
The pKa value of the conjugated acid of the pyrimidine nitrogen N1 estimated using MarvinSketch.
b
Mean IC50 for T. brucei AdoMetDC/prozyme at pH 7.2 determined using the RapidFire–MS-based enzyme activity assay, in triplicate, with 95% confidence interval (CI) shown in parentheses.
c
Mean IC50 for human AdoMetDC at pH 7.2 determined in the RapidFire–MS-based enzyme activity assay, in triplicate, with 95% CI shown in parentheses.
d
Mean EC50 as measured in the ATP–bioluminescence-based bloodstream form T. brucei Lister 427 cell viability assay, in triplicate, with 95% CI shown in parentheses. Percent inhibition at the maximal tested concentration (in μM) is shown when maximum mean inhibition was <50%.