Figure 4.
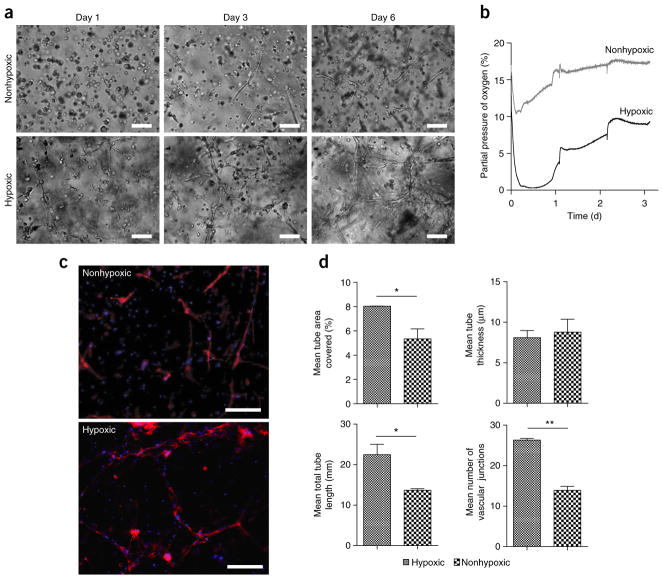
Tubulogenesis in Gel-HI. (a) Light microscopy images of early vascular cells (EVCs) derived from induced pluripotent stem cells in the Gel-HI hydrogels (hypoxic versus nonhypoxic) encapsulated at 2 million cells per ml. Scale bars, 100 μm. (b) Dissolved oxygen levels measured in EVC-Gtn-HI constructs encapsulated at 2 million cells per ml. Measurements were taken immediately after encapsulation. (c) Fluorescence microscopy images of EVCs after 6 d of culture. Phalloidin (red) merged with DAPI (blue). Scale bars, 500 μm. (d) Quantitative analysis of vascular tube formation. Results are shown as means ± s.d. n = 8 for hypoxic hydrogels; n = 10 for nonhypoxic hydrogels. *P < 0.05; **P < 0.01.

