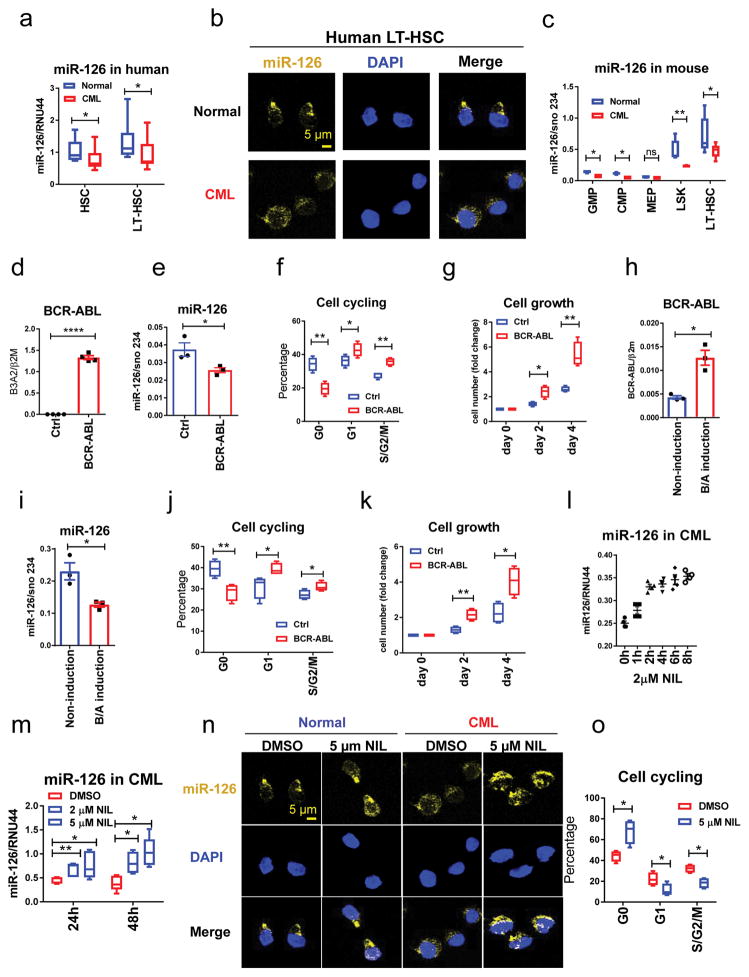
Figure 2. BCR-ABL down-regulates miR-126 expression in CML cells.
(a–b) miR-126 expression in normal and CML cell populations from human samples, as assessed by QPCR (n=10 biologically independent samples) (a) and miRNA staining (b) using 3 independent samples with similar results. (c) miR-126 expression, as assessed by QPCR, in the indicated BM cell populations from normal and CML mice (n=6). (d,e) BCR-ABL (d) and miR-126 (e) expression in normal mouse BM LSK cells transduced with BCR-ABL or control (Ctrl) retroviruses, as assessed by QPCR at 24 h after transduction (n=4 independent experiments). (f,g) Cell cycle (f) and cell growth (g) analyses (n=4 independent experiments) of the cells from d, e at 48 h after transduction. (h,i) BCR-ABL (h) and miR-126 (i) expression, as assessed by QPCR, in LT-HSCs from non-induced CML mice (tet off) cultured for 24 h in the presence (non-induction) or absence (BCR-ABL (B/A) induction) of tetracycline (2 μg/ml) (n=3 independent animals in each group). (j,k) Cell cycle (j) and cell growth (k) analyses (n=4 independent experiments in each group) of the cells from h,i at 48 h after BCR-ABL induction. (l) miR-126 expression, as assessed by QPCR, in human CML Lin−CD34+CD38− cells treated with NIL (2 μM) for the indicated periods of time (n=4 independent experiments). Mean±SEM was shown. (m) miR-126 expression, as assessed by QPCR, in CML Lin−CD34+CD38− cells treated with DMSO (Ctrl), 2 μM or 5 μM NIL (n=5 independent samples). (n) miR-126 expression, as assessed by miRNA staining, in normal and CML Lin−CD34+CD38− cells treated with DMSO or NIL (5 μM ) The experiments were repeated using 4 independent samples with similar results. (o) Cell cycle analysis of human CML Lin−CD34+CD38− cells treated with DMSO (Ctrl) or 5 μM NIL (n=4). Comparison between groups was performed by two-tailed, unpaired Student’s t-test. P values ≤0.05 were considered significant. Results shown represent mean ± SEM. *p ≤ 0.05, **p < 0.01, ***p < 0.001, ****p < 0.0001.

