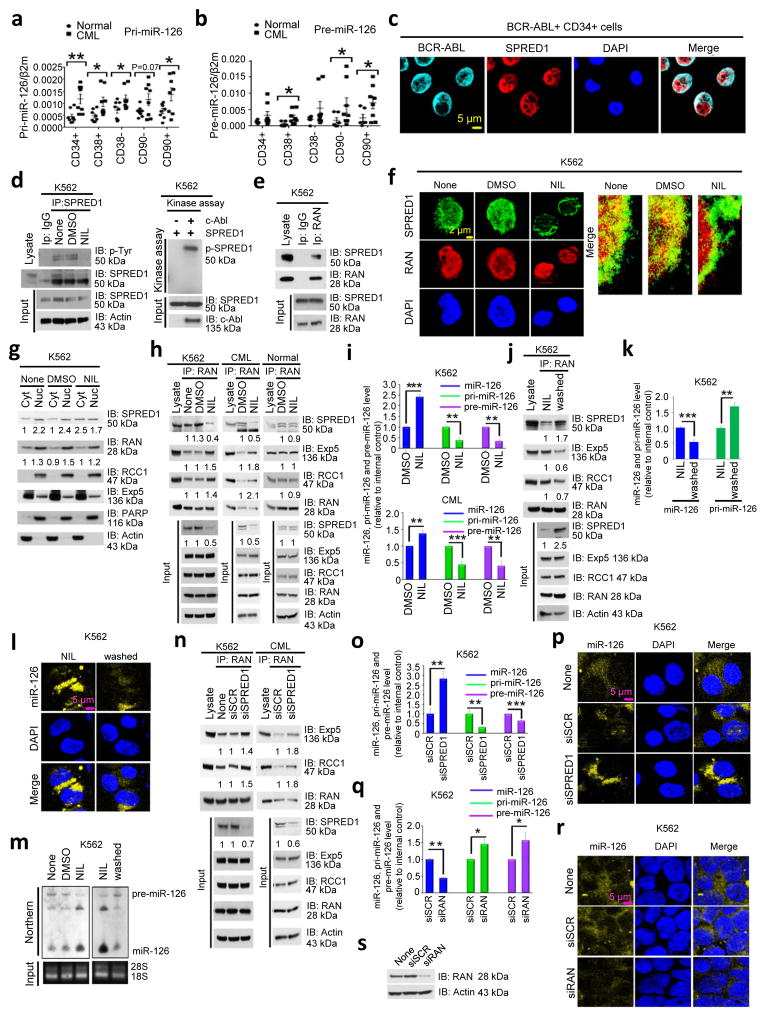
Figure 3. BCR-ABL deregulates miR-126 biogenesis.
(a,b) pri-miR-126 (n=8 biologically independent samples) (a) and pre-miR-126 (n=8 biologically independent samples) (b) expression levels, as assessed by QPCR, in the indicated human normal and CML cell populations. (c) BCR-ABL and SPRED1 staining in CML CD34+ cells by immunofluorescence (IF). (d) Immunoprecipitation (IP) with anti-SPRED1 followed by immunoblotting (IB) with anti-SPRED1 and anti-phosphotyrosine (p-Tyr) antibodies (left) and an in vitro kinase assay (right), as performed by IP with anti-c-Abl or anti-normal mouse IgG as control and immunoblotting with anti-SPRED1, in lysates of K562 cells treated with none, DMSO (vehicle) or NIL. (e) IP with anti-RAN followed by IB with anti-SPRED1 and anti-RAN antibodies in lysates of K562 cells. (f) SPRED1 and RAN staining by IF in K562 cells treated with none, DMSO or NIL. (g) SPRED1, RAN, RCC1 and Exp-5 expression in cytoplasmic (Cyt) and nuclear (Nu) fractions from K562 cells, treated with DMSO or NIL, as assessed by IB. Densitometric quantification of selected bands is shown (normalized to the actin loading control for total and Cyt lysates or to the PARP loading control for Nu lysates). (h) IP with anti-RAN followed by IB with anti-SPRED1, RAN, Exp-5 and RCC1 antibodies in lysates of K562 cells, CML CD34+ cells, and normal CD34+ cells treated with DMSO or NIL. Densitometric quantification of selected bands is shown (normalized to the actin loading control). (i) Mature, pri- and pre-miR-126 expression, as assessed by QPCR, in K562 and CML CD34+ cells treated with DMSO or NIL (n=3 independent experiments for K562 and 3 independent samples for CML cells). (j) IP with anti-RAN followed by IB with anti-SPRED1, Exp-5, RCC1 and RAN antibodies in lysates of K562 cells without or with washing-off of NIL. Densitometric quantification of selected bands is shown (normalized to the actin loading control). (k–m) Mature and pri-miR-126 expression as assessed by QPCR (n=3 independent experiments) (k), miR-126 staining (l), and mature and pre-miR-126 levels as assessed by Northern blotting (m) in K562 cells with or without washing-off of NIL. (n) IP with anti-RAN followed by IB with anti-Exp-5, RCC1 and RAN antibodies in lysates of K562 and CML CD34+ cells with control (siSCR) or SPRED1 (siSPRED1) knockdown. Densitometric quantification of selected bands is shown (normalized to the actin loading control. (o,p) Mature, pri- and pre-miR-126 expression, assessed by QPCR (n=3 independent experiments) (o) and miR-126 staining (p) in siSCR and siSPRED1 treated K562 cells. (q–s) Mature, pri- and pre-miR-126 expression, as assessed by QPCR (n=3 independent experiments) (q) and miR-126 staining (r) in K562 cells without (siSCR) or with RAN KD (siRAN), as assessed by IB with anti-RNA and anti-actin antibodies (s). All of the above IF, IP, IB and miRNA staining experiments including 3c–h, j, l–n, p, r, s, were repeated at least twice using independent samples, with similar results. Full-length gels and blots with molecular weight standards for 3d, e, g, h, j, m, n, q were provided in Supplementary Fig. 8–10. Comparison between groups was performed by two-tailed, unpaired Student’s t-test. P values ≤0.05 were considered significant. Results shown represent mean ± SEM. *p ≤ 0.05, **p < 0.01, ***p < 0.001, ****p < 0.0001.

