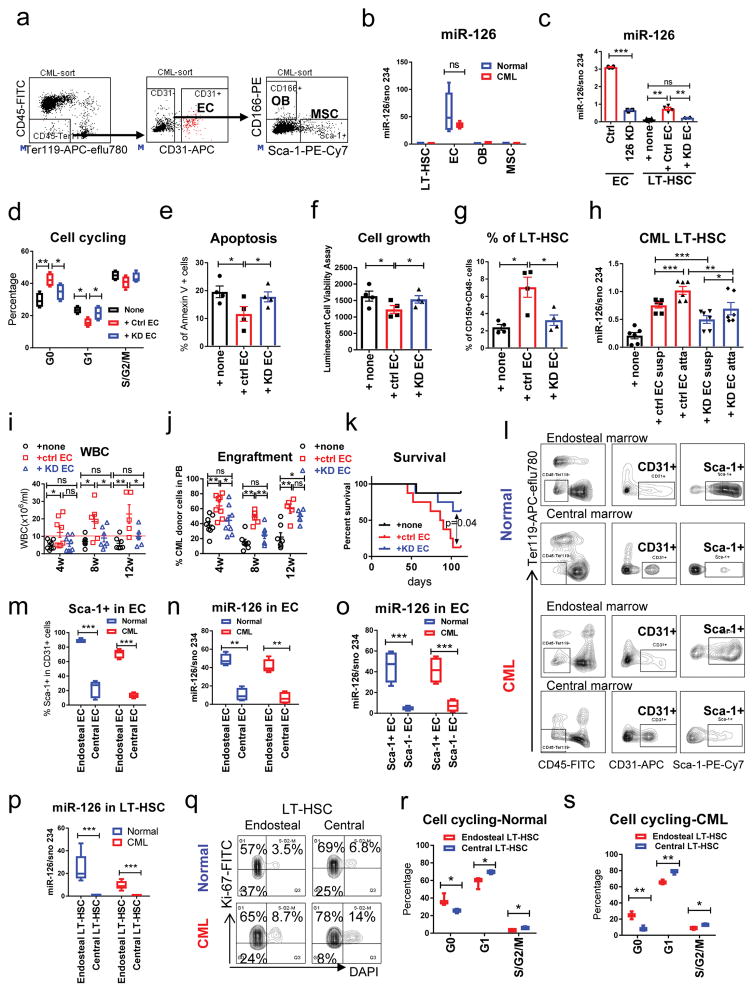
Figure 4. Endothelial cells in the niche supply miR-126 to normal and CML LT-HSCs.
(a) Gating strategy for the isolation of ECs (CD45−Ter119−CD31+), osteoblasts (OBs, CD45−Ter119−CD31−CD166+Sca-1−) and mesenchymal stem cells (MSCs, CD45−Ter119−CD31−CD166−Sca-1+). These experiments were repeated 5 times independently with similar results. (b) miR-126 expression, as assessed by QPCR in LT-HSCs, ECs, OBs and MSCs from normal and CML mice (n=5 biologically independent samples). (c) miR-126 expression in ECs from the BM of CML mice that were transduced with miR-126 KD (126 KD) or control (Ctrl) lentiviruses, or in CML LT-HSCs that were cultured alone (none) or co-cultured with the ECs that had been transduced with control (Ctrl EC) or miR-126 KD (KD EC) lentiviruses (n=4 biologically independent samples). (d–g) Cell cycle analysis (n=4 biologically independent samples) (d), apoptosis (n=4) (e), cell growth (n=4) (f) and the percentage of Flt3−CD150+CD48− LSK cells (n=4) (g) in CML LT-HSCs cultured alone or with control or miR-126 KD ECs. (h) miR-126 expression, as assessed by QPCR, in suspended (Susp) and EC-attached (Atta) sub-fractions of CML LT-HSCs (n=6 independent experiments). (i–k) WBC counts (i), CML donor cell engraftment in PB at the indicated times (j) and survival (k) after recipient mice were transplanted with CML LT-HSCs that had been cultured alone (none) or co-cultured with Ctrl or KD EC for 96 h (1,000 cells/mouse, n=8 in each group). Comparison between groups was performed by two-tailed, unpaired Student’s t-test. The log-rank test was used to assess significant differences between survival curves. (l,m) Representative flow cytometry plots of EC staining (l) and frequency of Sca-1+ cells (m) in endosteal or central ECs from normal and CML mice (n=4 independent samples). (n–o) miR-126 expression, as assessed by QPCR, in endosteal or central ECs (n=4 independent samples) (n) and in Sca-1+ or Sca-1− ECs (n=4 independent samples) (o) from normal and CML mice. (p) miR-126 expression, as assessed by QPCR, in endosteal or central LT-HSCs from normal and CML mice (n=6 independent samples). (q–s) Representative flow cytometry plots of Ki-67 and DAPi staining of endosteal or central LT-HSCs from normal and CML mice (q), cell cycle analysis of endosteal or central LT-HSCs from normal (n=3) (r) or CML (n=3) (s) mice. Comparison between groups was performed by two-tailed, paired Student’s t-test. P values ≤0.05 were considered significant. Results shown represent mean ± SEM. *p ≤ 0.05, **p < 0.01, ***p < 0.001, ****p < 0.0001.

