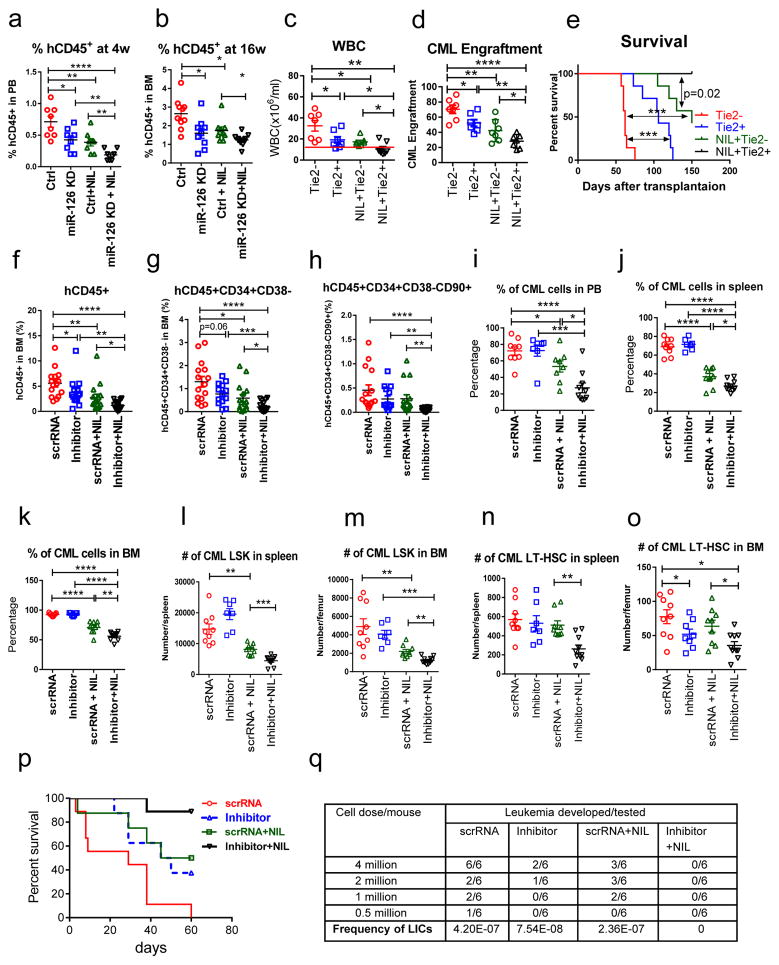
Figure 6. miR-126 knockdown by lentiviruses or CpG-miR-126 inhibitor in combination with nilotinib enhances the in vivo targeting of CML LSCs.
(a,b) Engraftment of human CD45+GFP+ cells in PB at 4 weeks (n=8 independent samples) (a) and in BM at 16 weeks (n=10 independent samples) (b) in NSG-SGM3 mice transplanted with human CML Lin−CD34+CD38− cells (5×10⁵ cells/mouse, n=8–10 in each group), which were transduced with miR-126 KD or control lentiviruses and treated with NIL (5 μM) for 4 days. (c–e) WBC counts (c), CML donor cell engraftment (d) and survival (e) of CD45.2 miR-126flox/wt/Tie2+ or Tie2− mice transplanted with CD45.1/CD45.2 CML LT-HSCs and treated with or without NIL (n=7 in each group) for 3 weeks. The log-rank test was used to assess significant differences between survival curves. (f–h) Human CD45+ (f), CD45+CD34+CD38− HSC (g) and CD45+CD34+CD38−CD90+ LT-HSC (h) engraftment in BM of NSG-SGM3 mice transplanted with human CD34+ cells from CP CML patient samples and then treated with scrRNA (5mg/kg, i.v. 4 times a week, n=15), inhibitor (5mg/kg i.v. 4 times a week, n=14), scrRNA + NIL (50mg/kg, daily by gavage, n=15), or inhibitor + NIL (n=16) for 3 weeks (total 60 mice). (i–o) Percentage of donor CML cells in PB (i), spleen (j) and BM (k), numbers of donor CML LSK in spleen (l) and BM (m), and numbers of donor CML LT-HSC in spleen (n) and BM (o) of recipient mice transplanted with CML BM cells and then treated with scrRNA (n=9), inhibitor (n=7), scrRNA + NIL (n=8), or inhibitor + NIL (n=10) for 3 weeks (total 34 mice). (p) Survival of another cohort of CML mice treated with scrRNA (n=9), inhibitor (n=8), scrRNA + NIL (n=8), or inhibitor + NIL (n=9) for 3 weeks (total 34 mice). The log-rank test was used to assess significant differences between survival curves. (q) Frequency of leukemia initiating cells (LICs) in BM cells from treated leukemic mice, as assessed by leukemia development rate in secondary recipient mice transplanted with 4×10⁶, 2×10⁶, 1×10⁶, and 5×10⁵ BM cells/mouse from the treated mice (n=6 mice/dose/condition × 4 doses × 4 conditions = 96 mice) by L-Calc software. Comparison between groups was performed by two-tailed, unpaired Student’s t-test. P values ≤0.05 were considered significant. Results shown represent mean ± SEM. *p ≤ 0.05, **p < 0.01, ***p < 0.001, ****p < 0.0001.

