
Figure 1.
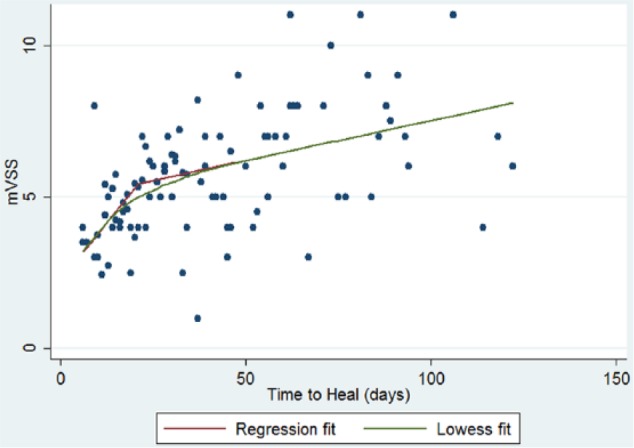
Scatter plot with LOWESS curve of piecewise regression model of relationship between TTH and mVSS total score.
Official websites use .gov
A
.gov website belongs to an official
government organization in the United States.
Secure .gov websites use HTTPS
A lock (
) or https:// means you've safely
connected to the .gov website. Share sensitive
information only on official, secure websites.
Scatter plot with LOWESS curve of piecewise regression model of relationship between TTH and mVSS total score.