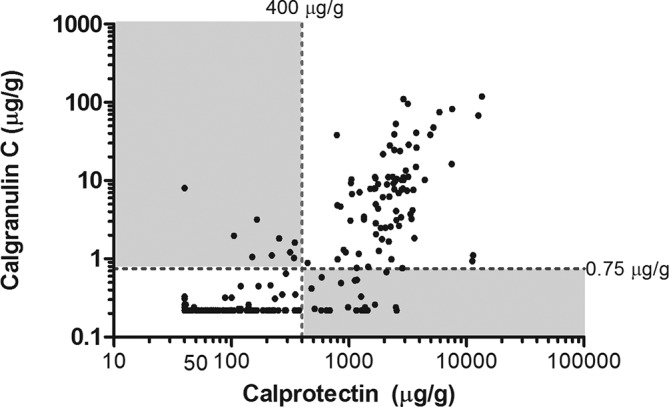
Figure 5.

Scatter plot showing concordant and discordant pairs of calprotectin and calgranulin-C measurements. The broken lines represent the ROC-based optimal thresholds for calprotectin (400 µg/g) and calgranulin-C (0.75 µg/g). White fields represent concordant pairs (91%), while grey fields represent discordant pairs (9%). ROC, receiver operating characteristic.
