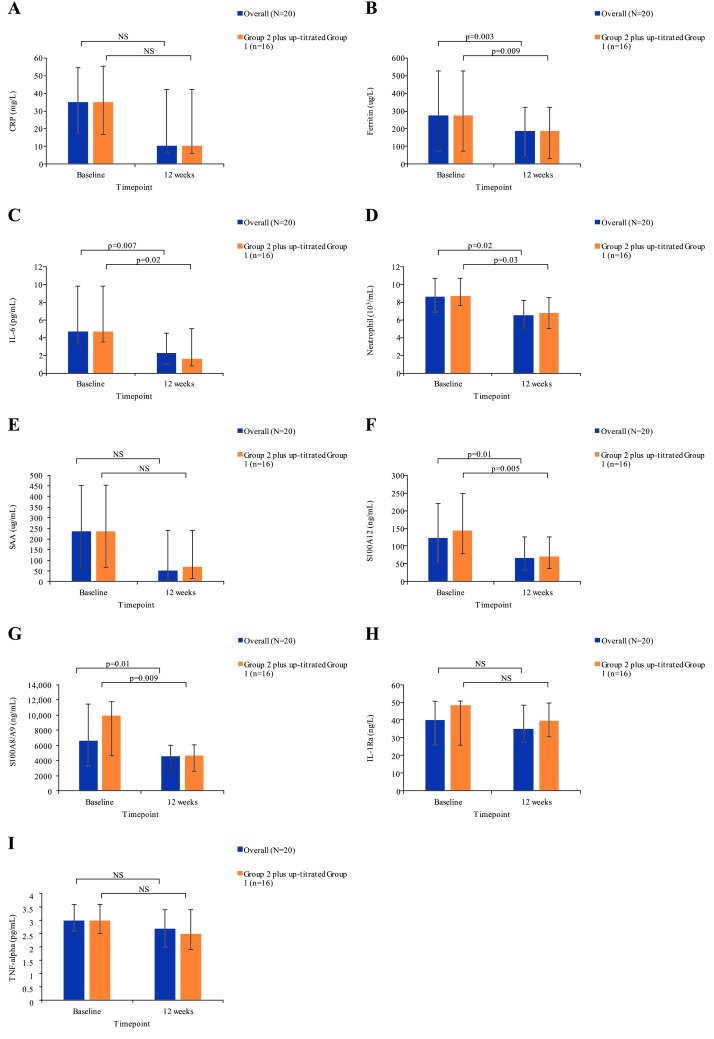
Figure 3.
Evolution of serum biomarker levels by group and time point: (A) CRP; (B) ferritin; (C) IL-6; (D) neutrophil; (E) SAA; (F) S100A12; (G) S100A8/A9; (H) IL-1Ra; (I) TNF-alpha. Data are median (IQR). The 20 patients included in the overall group comprised 17 patients who had baseline values and at week 12, and 3 patients with values at week 6, but who discontinued thereafter. Three patients who discontinued at earlier time points were not included. Group 2 plus up-titrated group 1, n=16. CRP, C reactive protein; IL, interleukin; Ra, receptor antagonist; NS, not significant; SAA, serum amyloid A; TNF, tumour necrosis factor.

