
Figure 4.
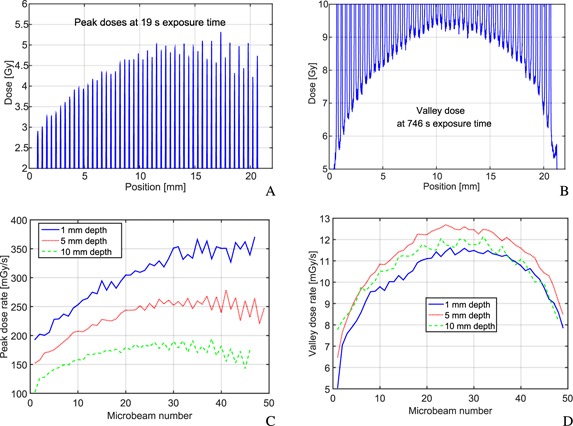
Results of film dosimetry and microscope readout are displayed for the produced 20 × 20 mm2 microbeam fields. The top row presents profiles at 5 mm depth. Due to the limited dose range of the EBT3 films, (A) was obtained with 19 s exposure time and (B) with 746 s exposure time. The bottom row compares peak (C) and valley (D) dose rates at 1, 5, and 10 mm depth (Fig. 1).